 ALPHA
ALPHA Live demo · 375 lb conventional deadlift × 6
Included with 1:1 Coaching
Alpha Tracker: every rep, measured.
Alpha Tracker is a feature of Alpha Trainer 1:1 coaching. Film your set and the video gets tracked frame by frame, then turned into a full performance report: power, bar speed, bar path, tempo and form, plus coaching notes for your next session. No guessing whether you're progressing. You see it.
Built for lifters in 1:1 coaching who want proof, not feelings: faster bar speed, more power at the same load, cleaner reps, and a clear target for next session.
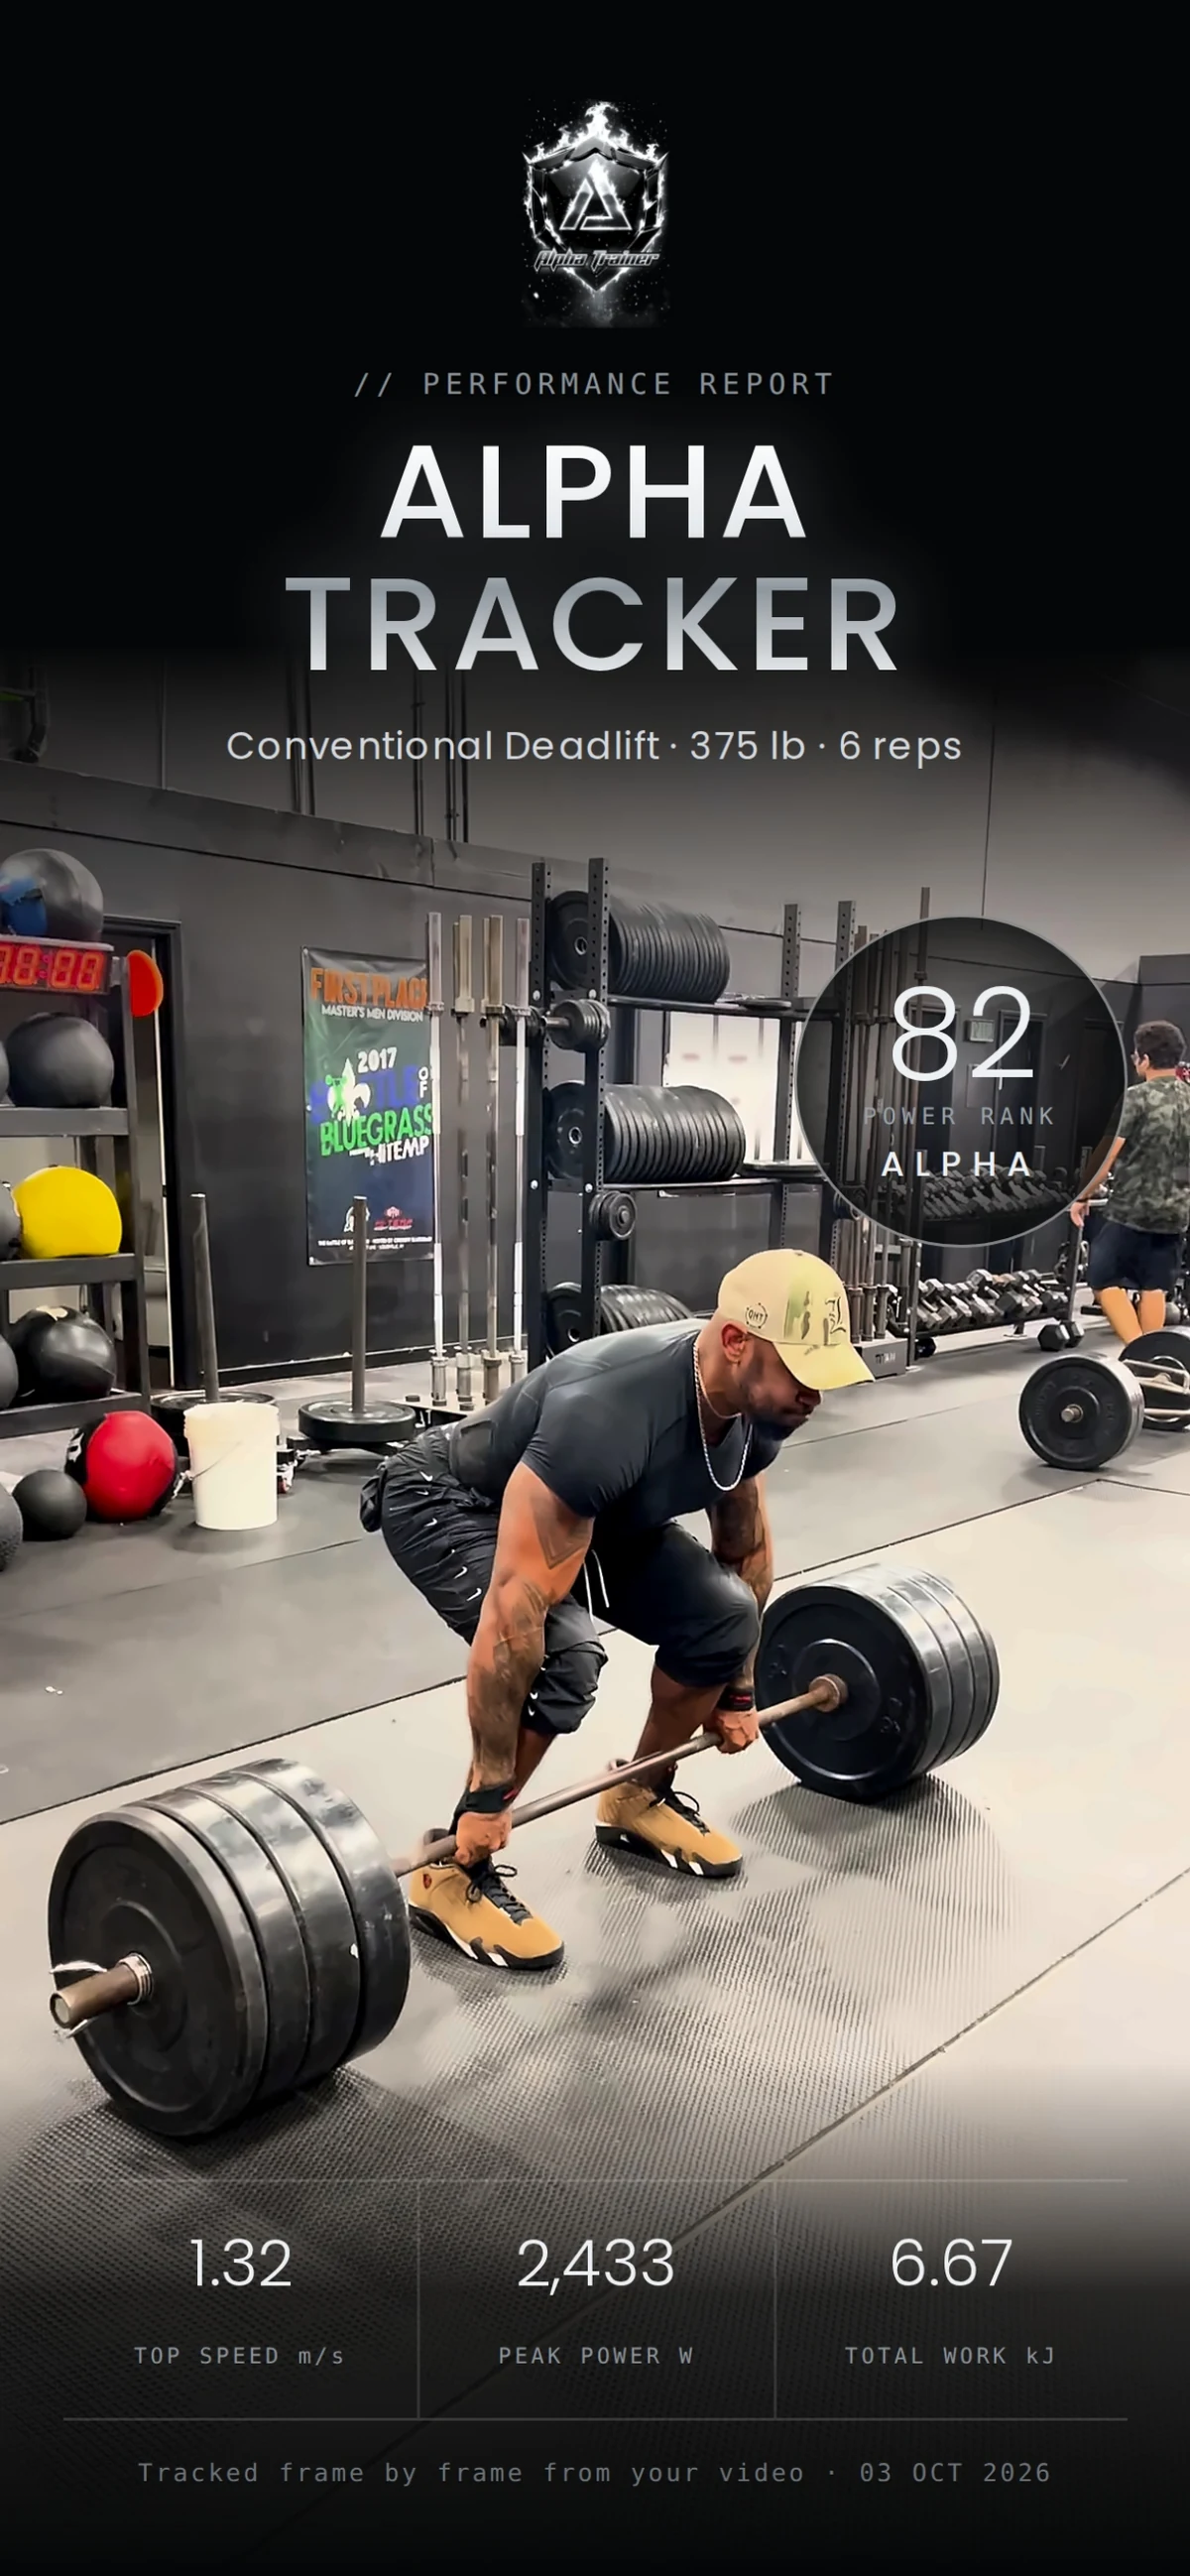

Real member report · Steve's 375 lb × 6 conventional deadlift
Power Rank tiers
- APEX90–100
- ALPHA75–89
- HUNTER50–74
- LONE WOLF25–49
- PUP0–24
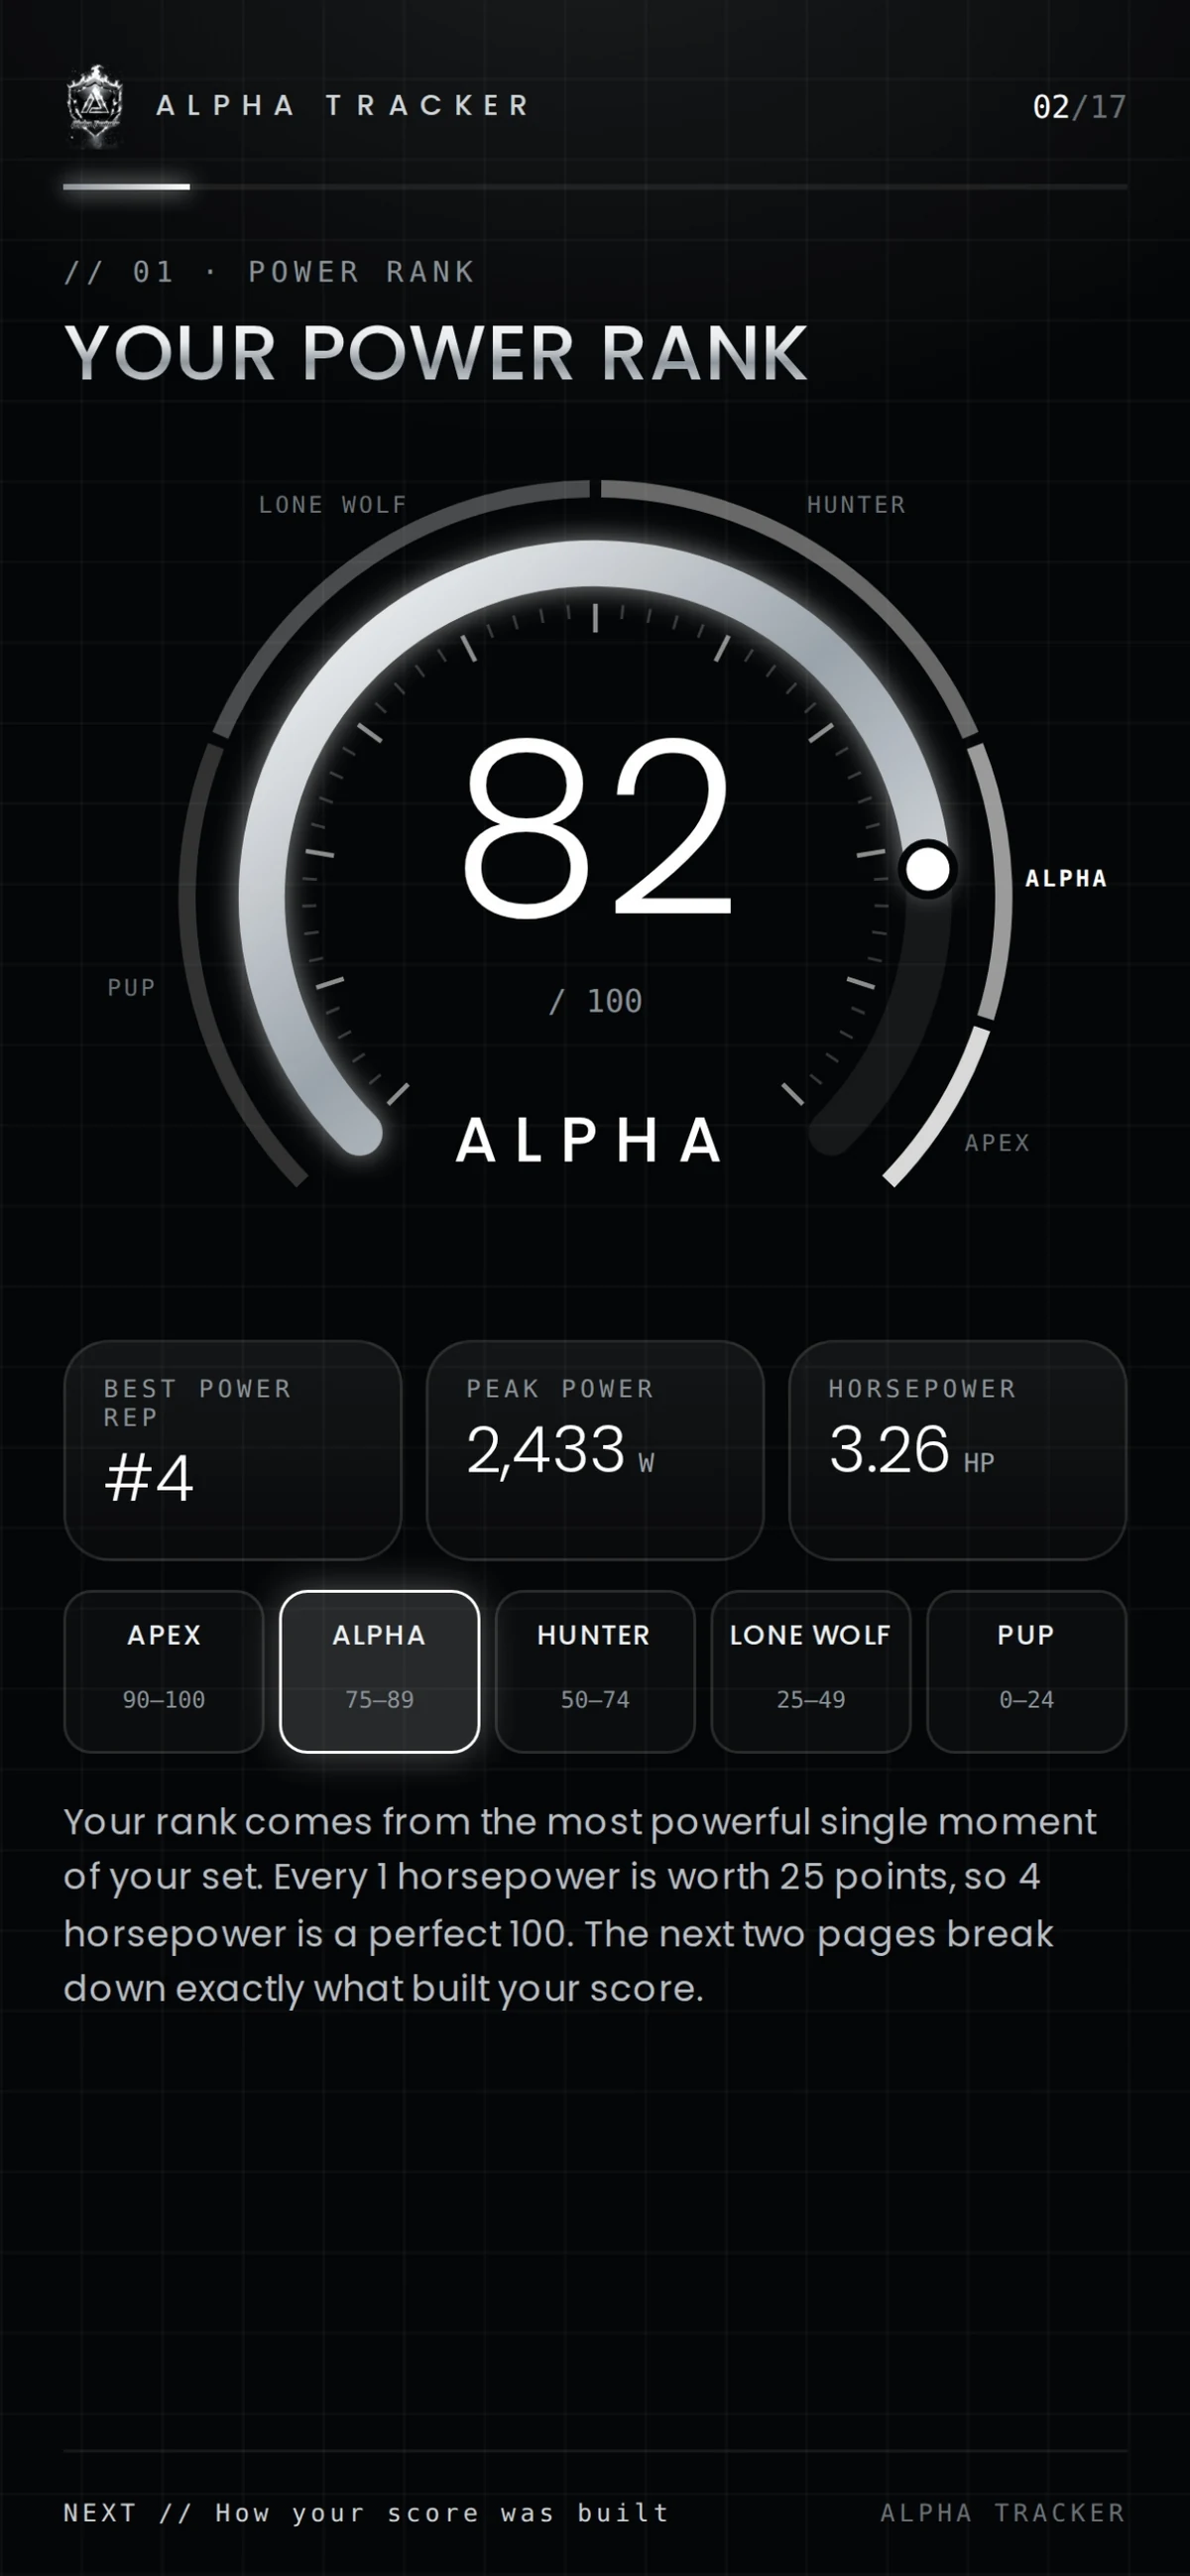
Your rank comes from the most powerful single moment of your set. Every 1 horsepower is worth 25 points, so 4 hp is a perfect 100.
Fill Out the Application →Inside the report
The full report, page by page
Every Alpha Tracker report follows the same order, from the cover to your next-session plan. Below is the sample deadlift report, section by section: what each page shows, how to read it, and why it matters.

Cover
The Cover
What it shows
The lift, the load and the reps, a frame from your own video, your Power Rank badge, and three headline numbers: top speed, peak power and total work.
How to read it
This is the one-glance summary. The date line confirms the report was tracked frame by frame from your video.
Why it matters
You know in seconds what was tested and how it went before you dig into the detail.
01 · Power Rank deep-dive
Power Rank
What it shows
A 0–100 score and tier, built from the most powerful single moment of your set, with your best power rep, peak power and horsepower beside the gauge.
How to read it
Find your tier on the gauge, then follow the math page from the bar on the floor to your rank. The next page breaks down which reps and which qualities built it.
Why it matters
One honest number you can retest. Same weight, same setup, same camera: if your Power Rank rises, you got more powerful.
The five tiers
- APEX90–100
- ALPHA75–89
- HUNTER50–74
- LONE WOLF25–49
- PUP0–24
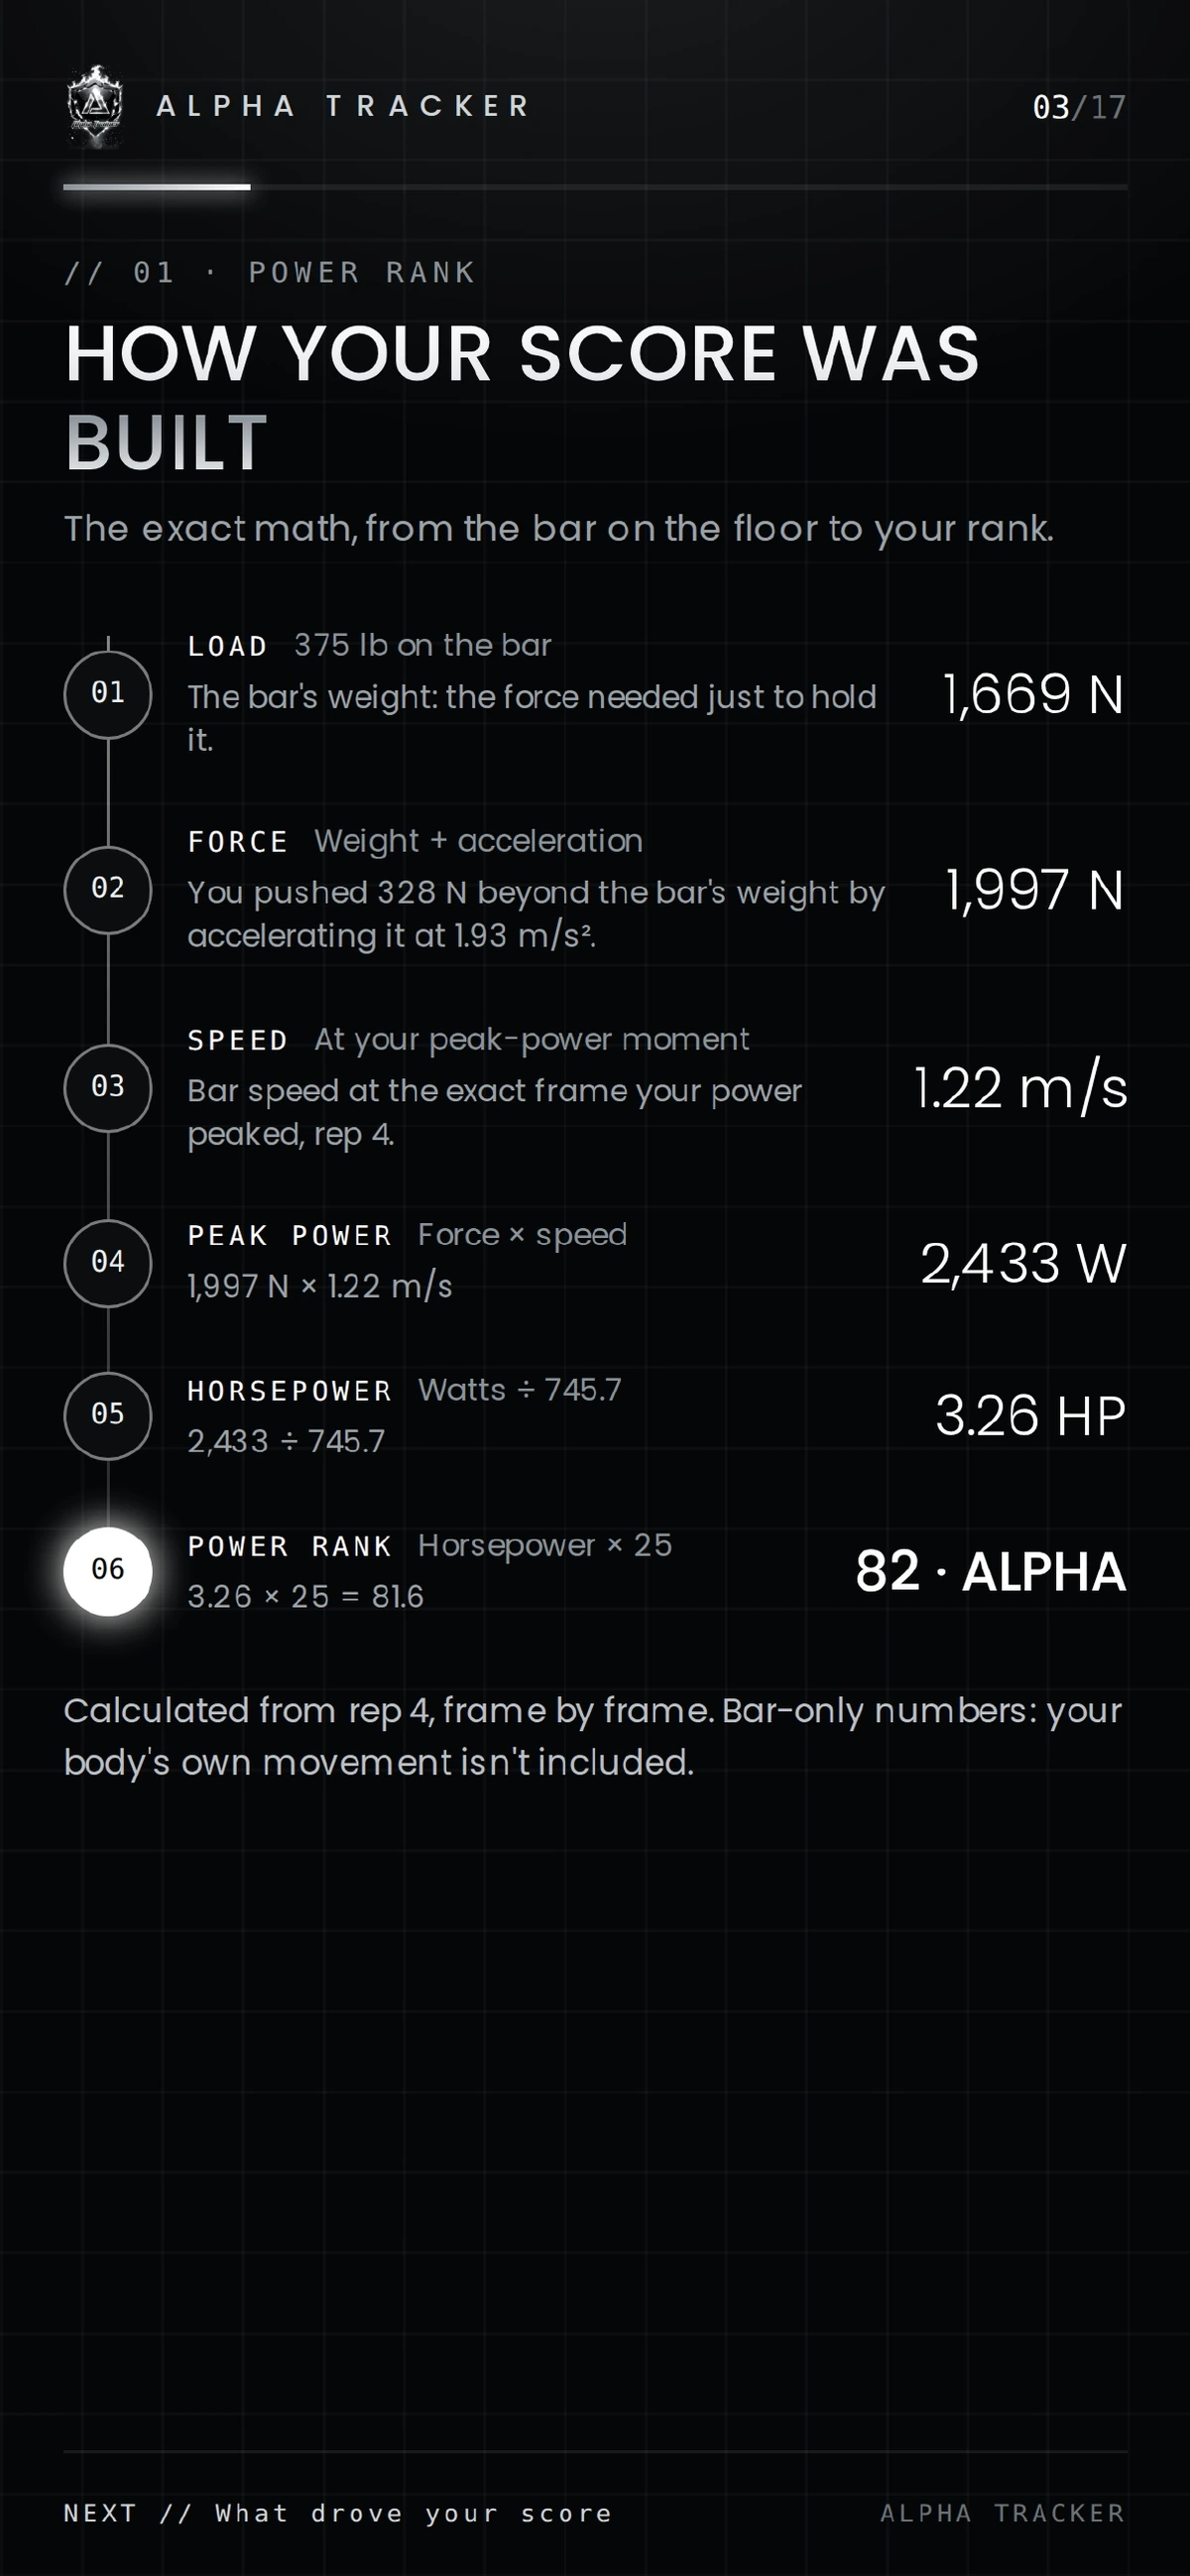
How the score is built
- Load The bar's weight: the force needed just to hold it.
- Force Weight plus acceleration: how hard you pushed beyond the bar's weight.
- Speed Bar speed at the exact frame your power peaked.
- Peak power Force × speed.
- Horsepower Watts ÷ 745.7.
- Power Rank Horsepower × 25. Every 1 hp is worth 25 points, so 4 hp is a perfect 100.
Calculated from your best rep, frame by frame. Bar-only numbers: your body's own movement isn't included.
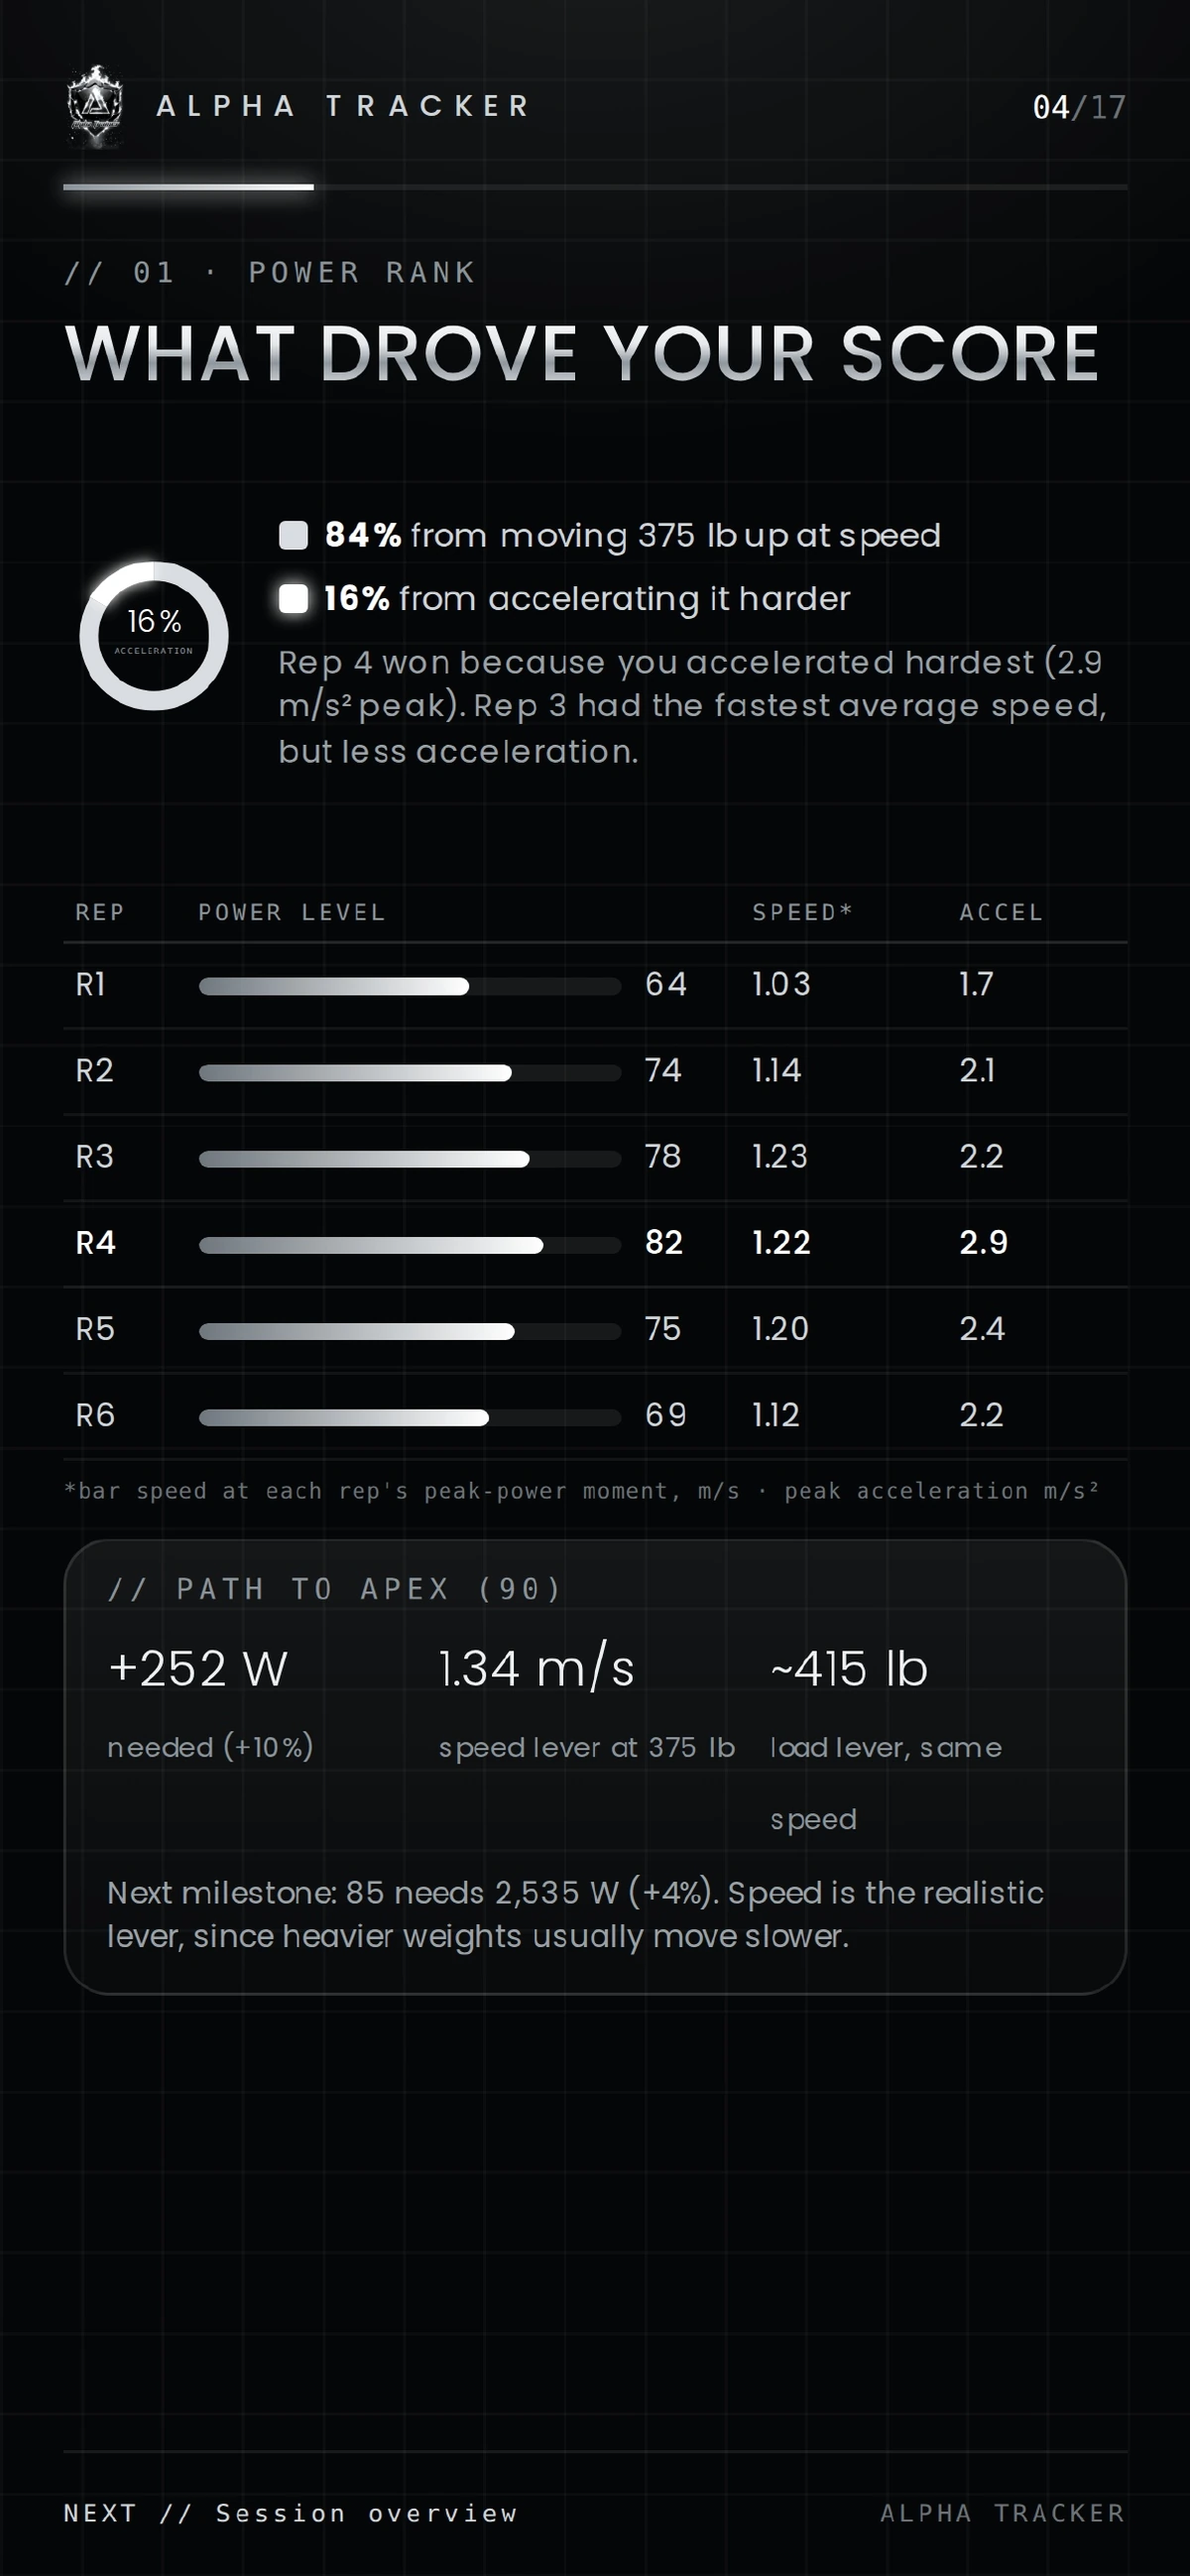
What drove your score
The report splits your peak power into how much came from moving the load at speed and how much came from accelerating it harder, shows a power level for every rep, and explains why your best rep won. A Path to Apex box shows what it would take to reach the next milestone, and which lever (usually speed) is the realistic one to pull.
02 · Session
Session overview
What it shows
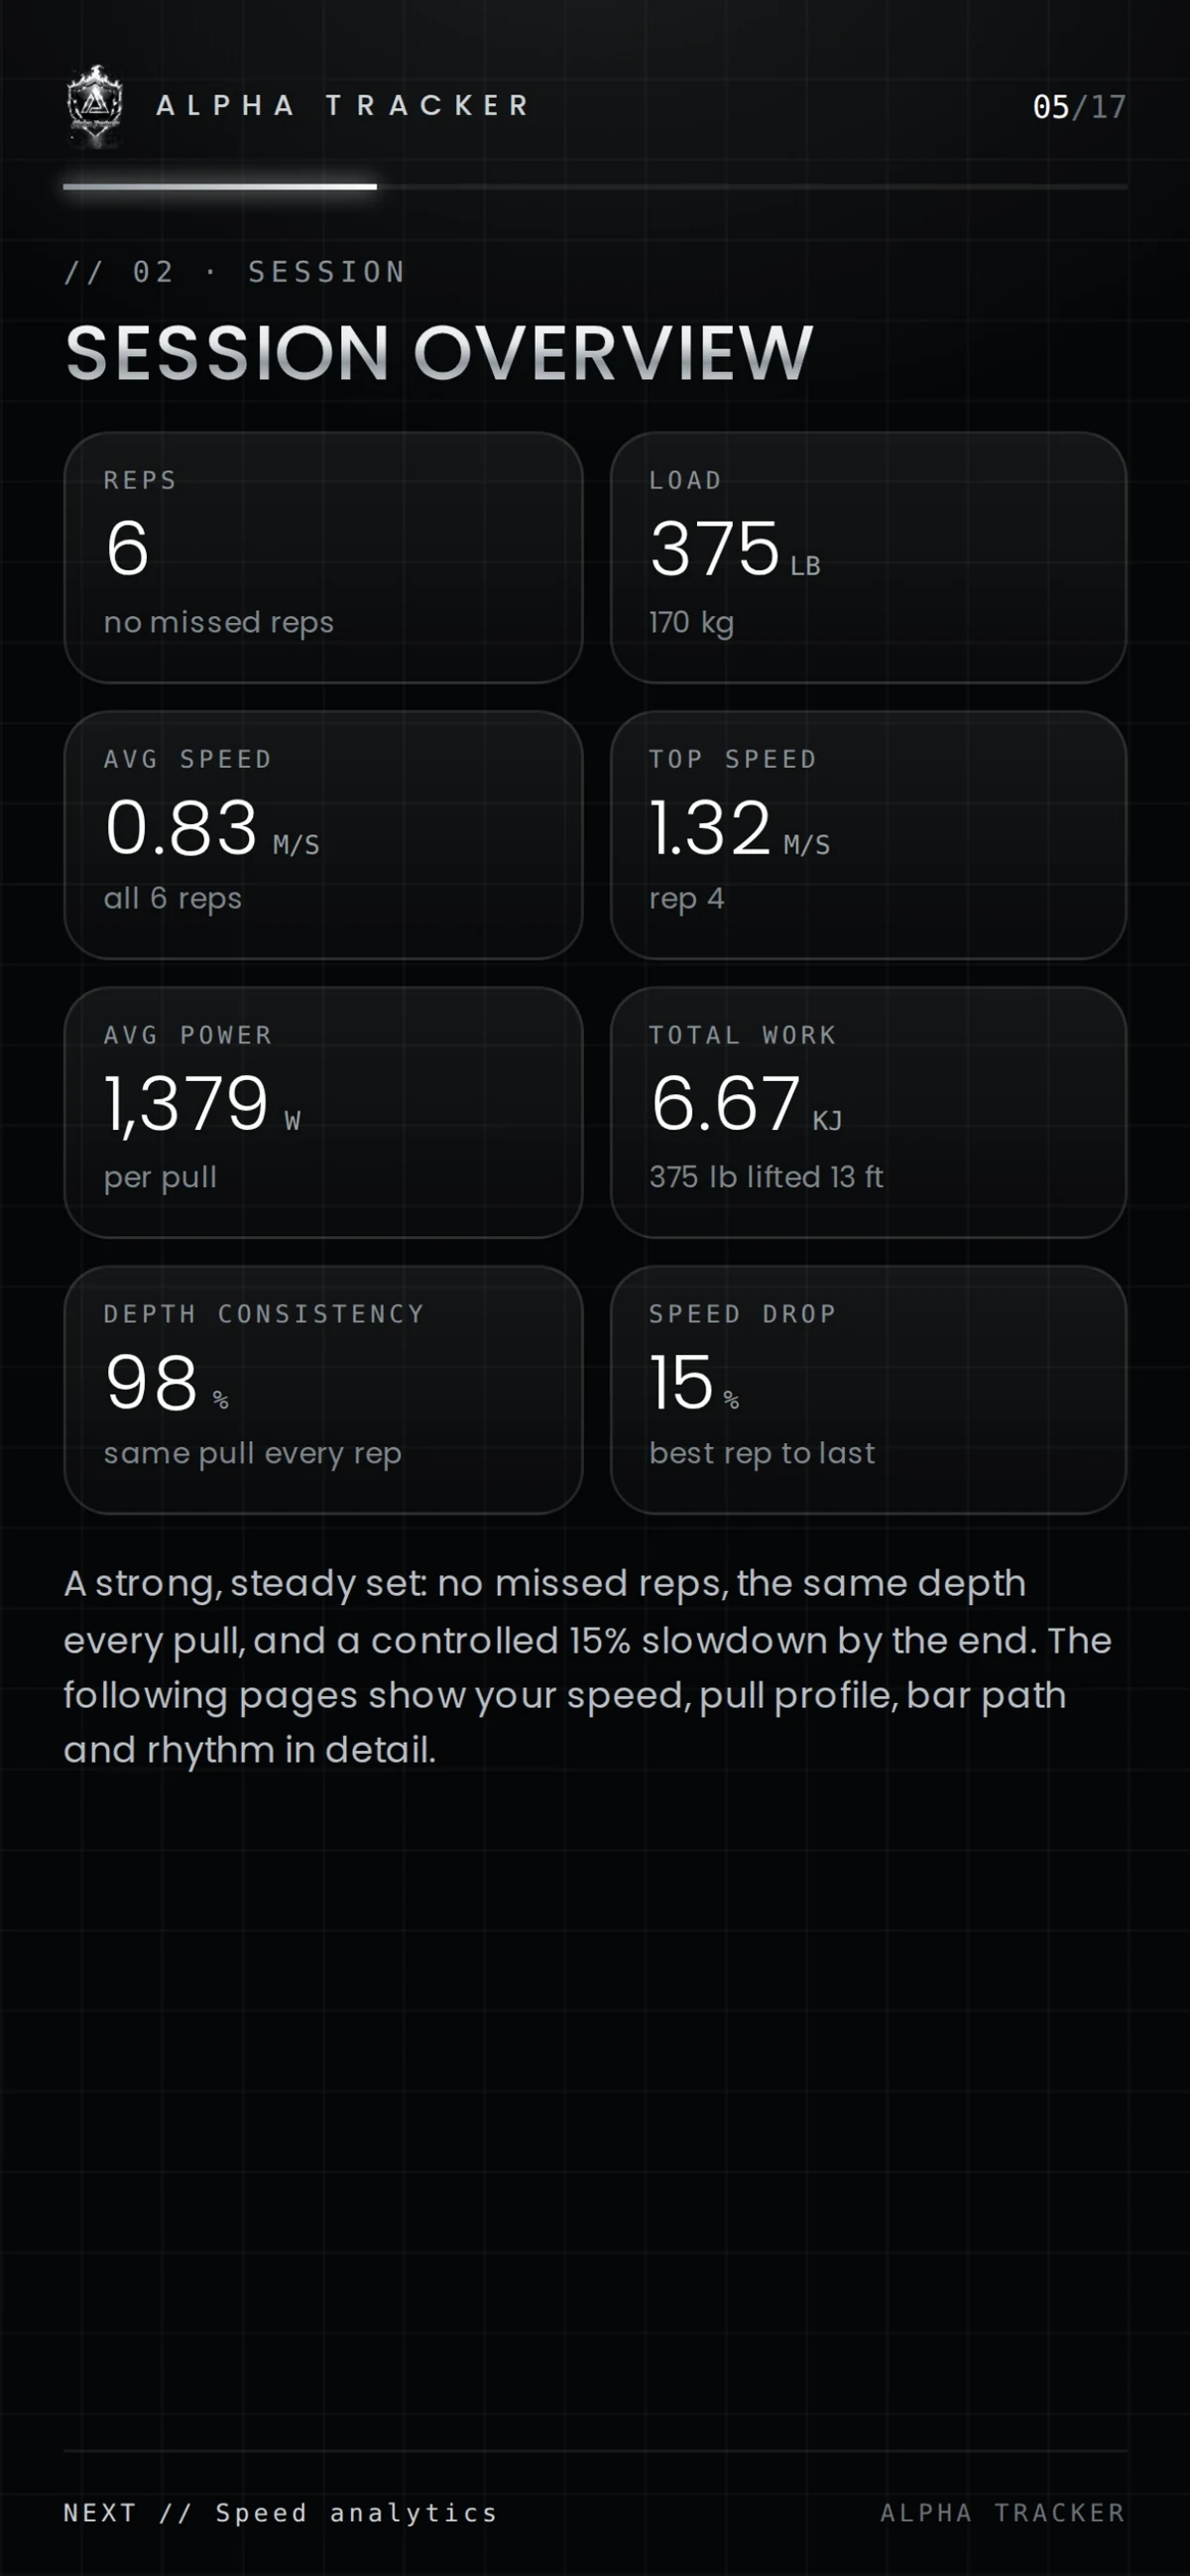
Reps, load, average and top speed, average power per pull, total work, depth consistency and speed drop from your best rep to your last.
How to read it
Read it as the scoreboard for the whole set: did you miss reps, did every pull go the same depth, and how much did you slow down by the end?
Why it matters
It tells your coach whether the set was strong and steady or falling apart, before looking at a single rep.
03 · Analytics
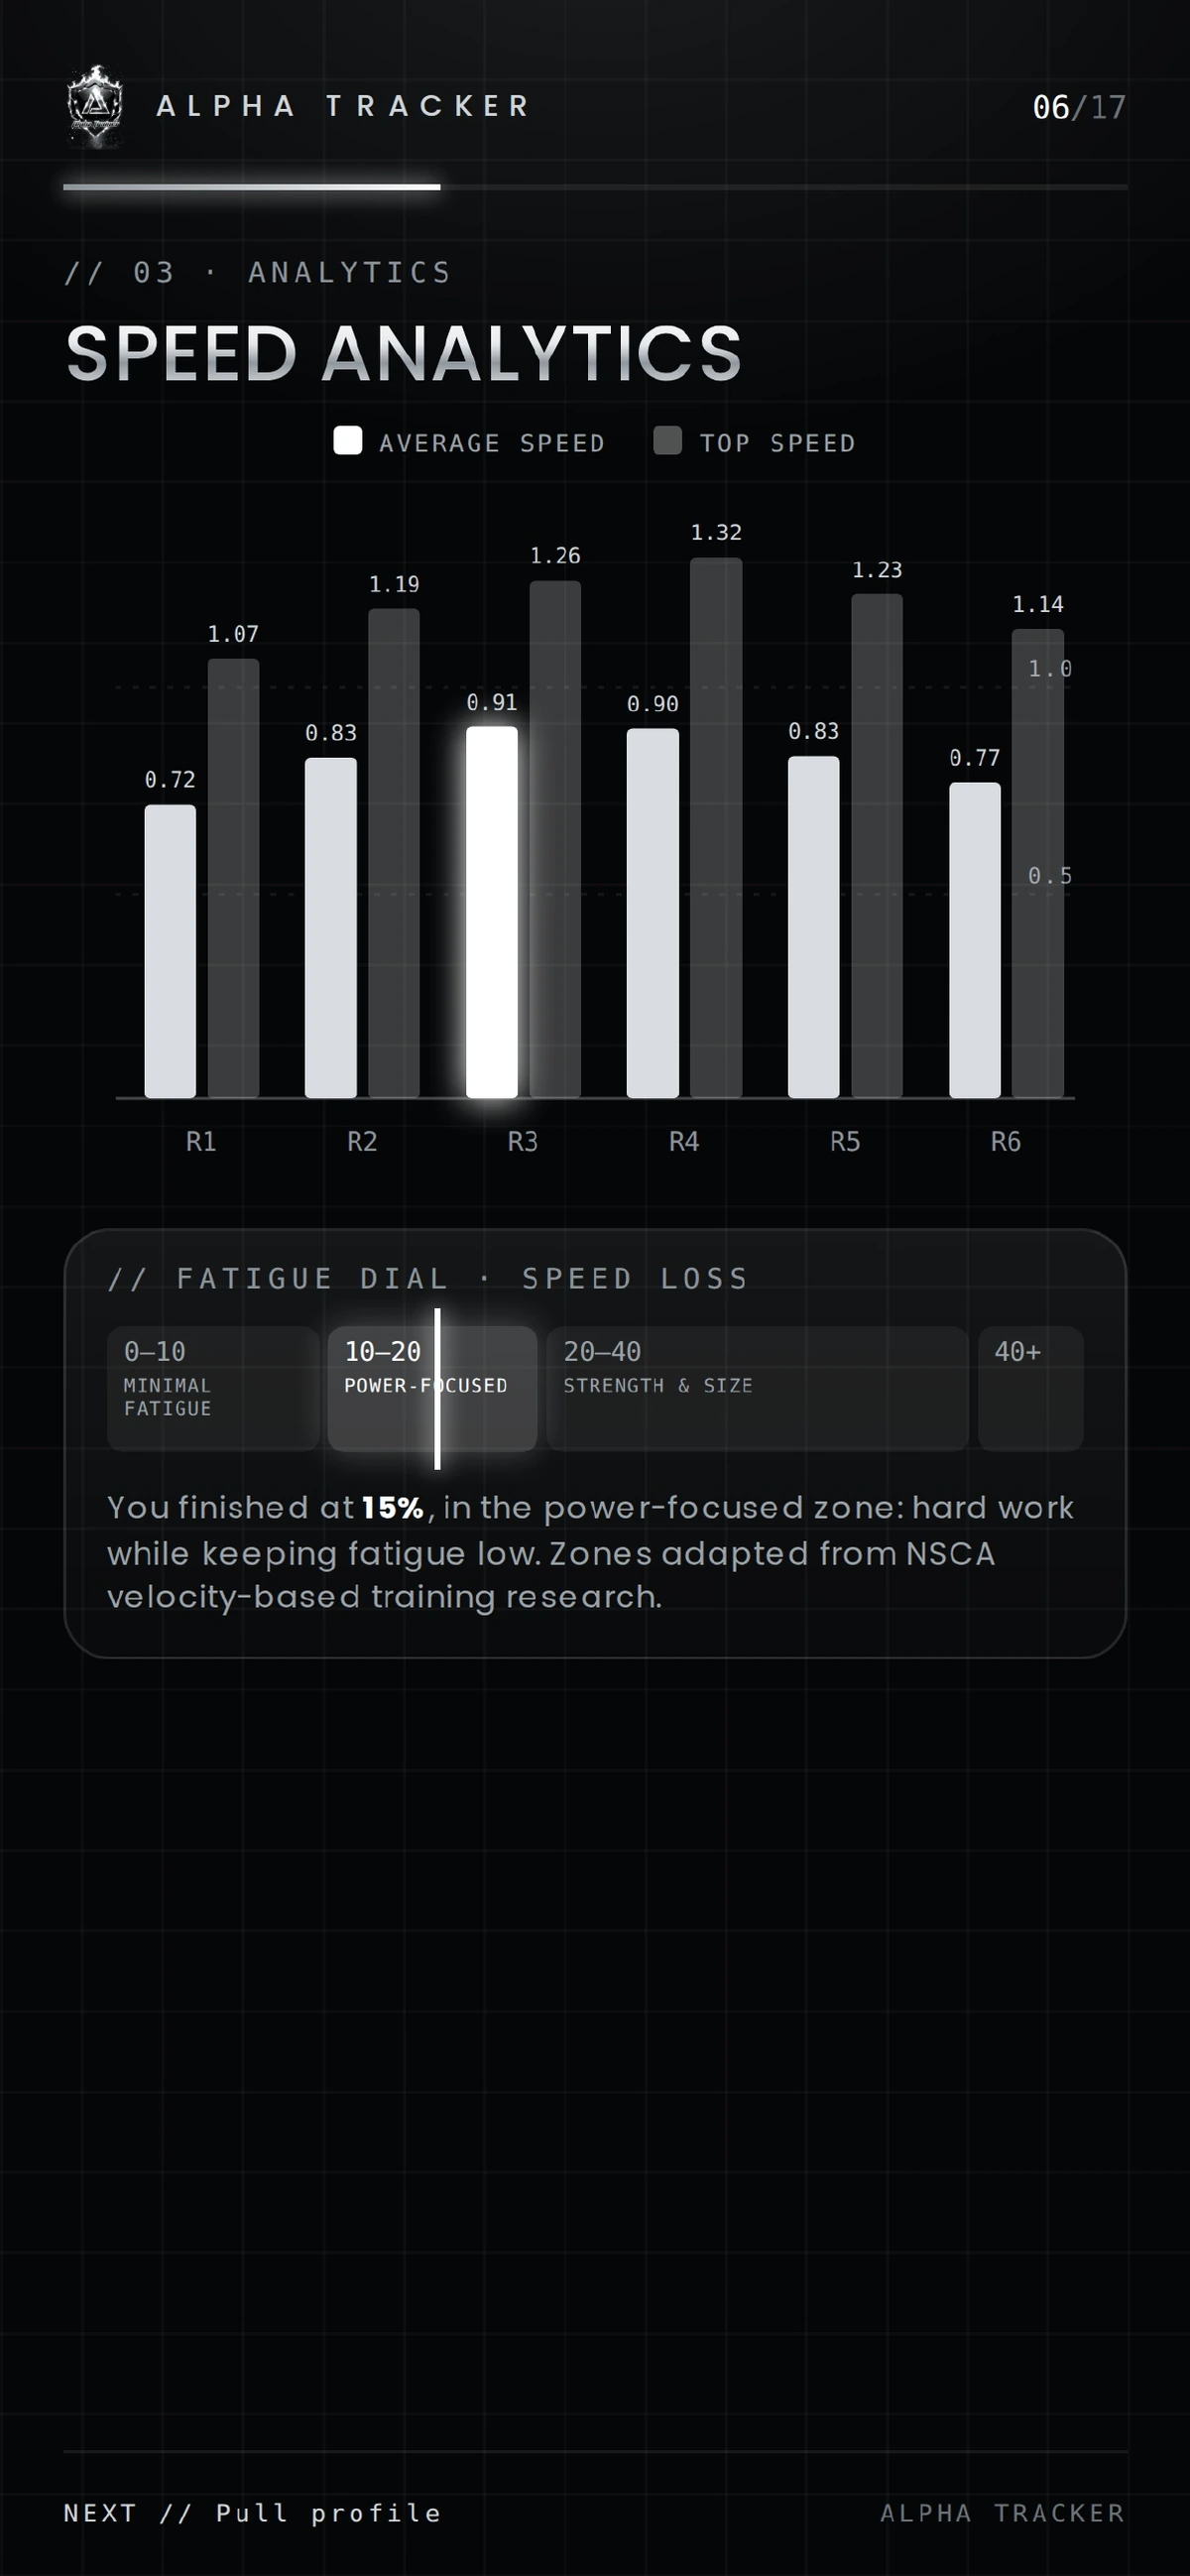
Speed analytics
What it shows
Average and top bar speed for every rep as a bar chart, plus a fatigue dial that places your speed loss in a zone: minimal fatigue, power-focused, strength & size, or beyond.
How to read it
Taller bars mean faster reps. Watch where the bars start to shrink, then check where the needle lands on the dial. The zones are adapted from NSCA velocity-based training research.
Why it matters
Speed loss is how your coach controls fatigue: it decides when a set should end for the goal you're training.
03 · Analytics
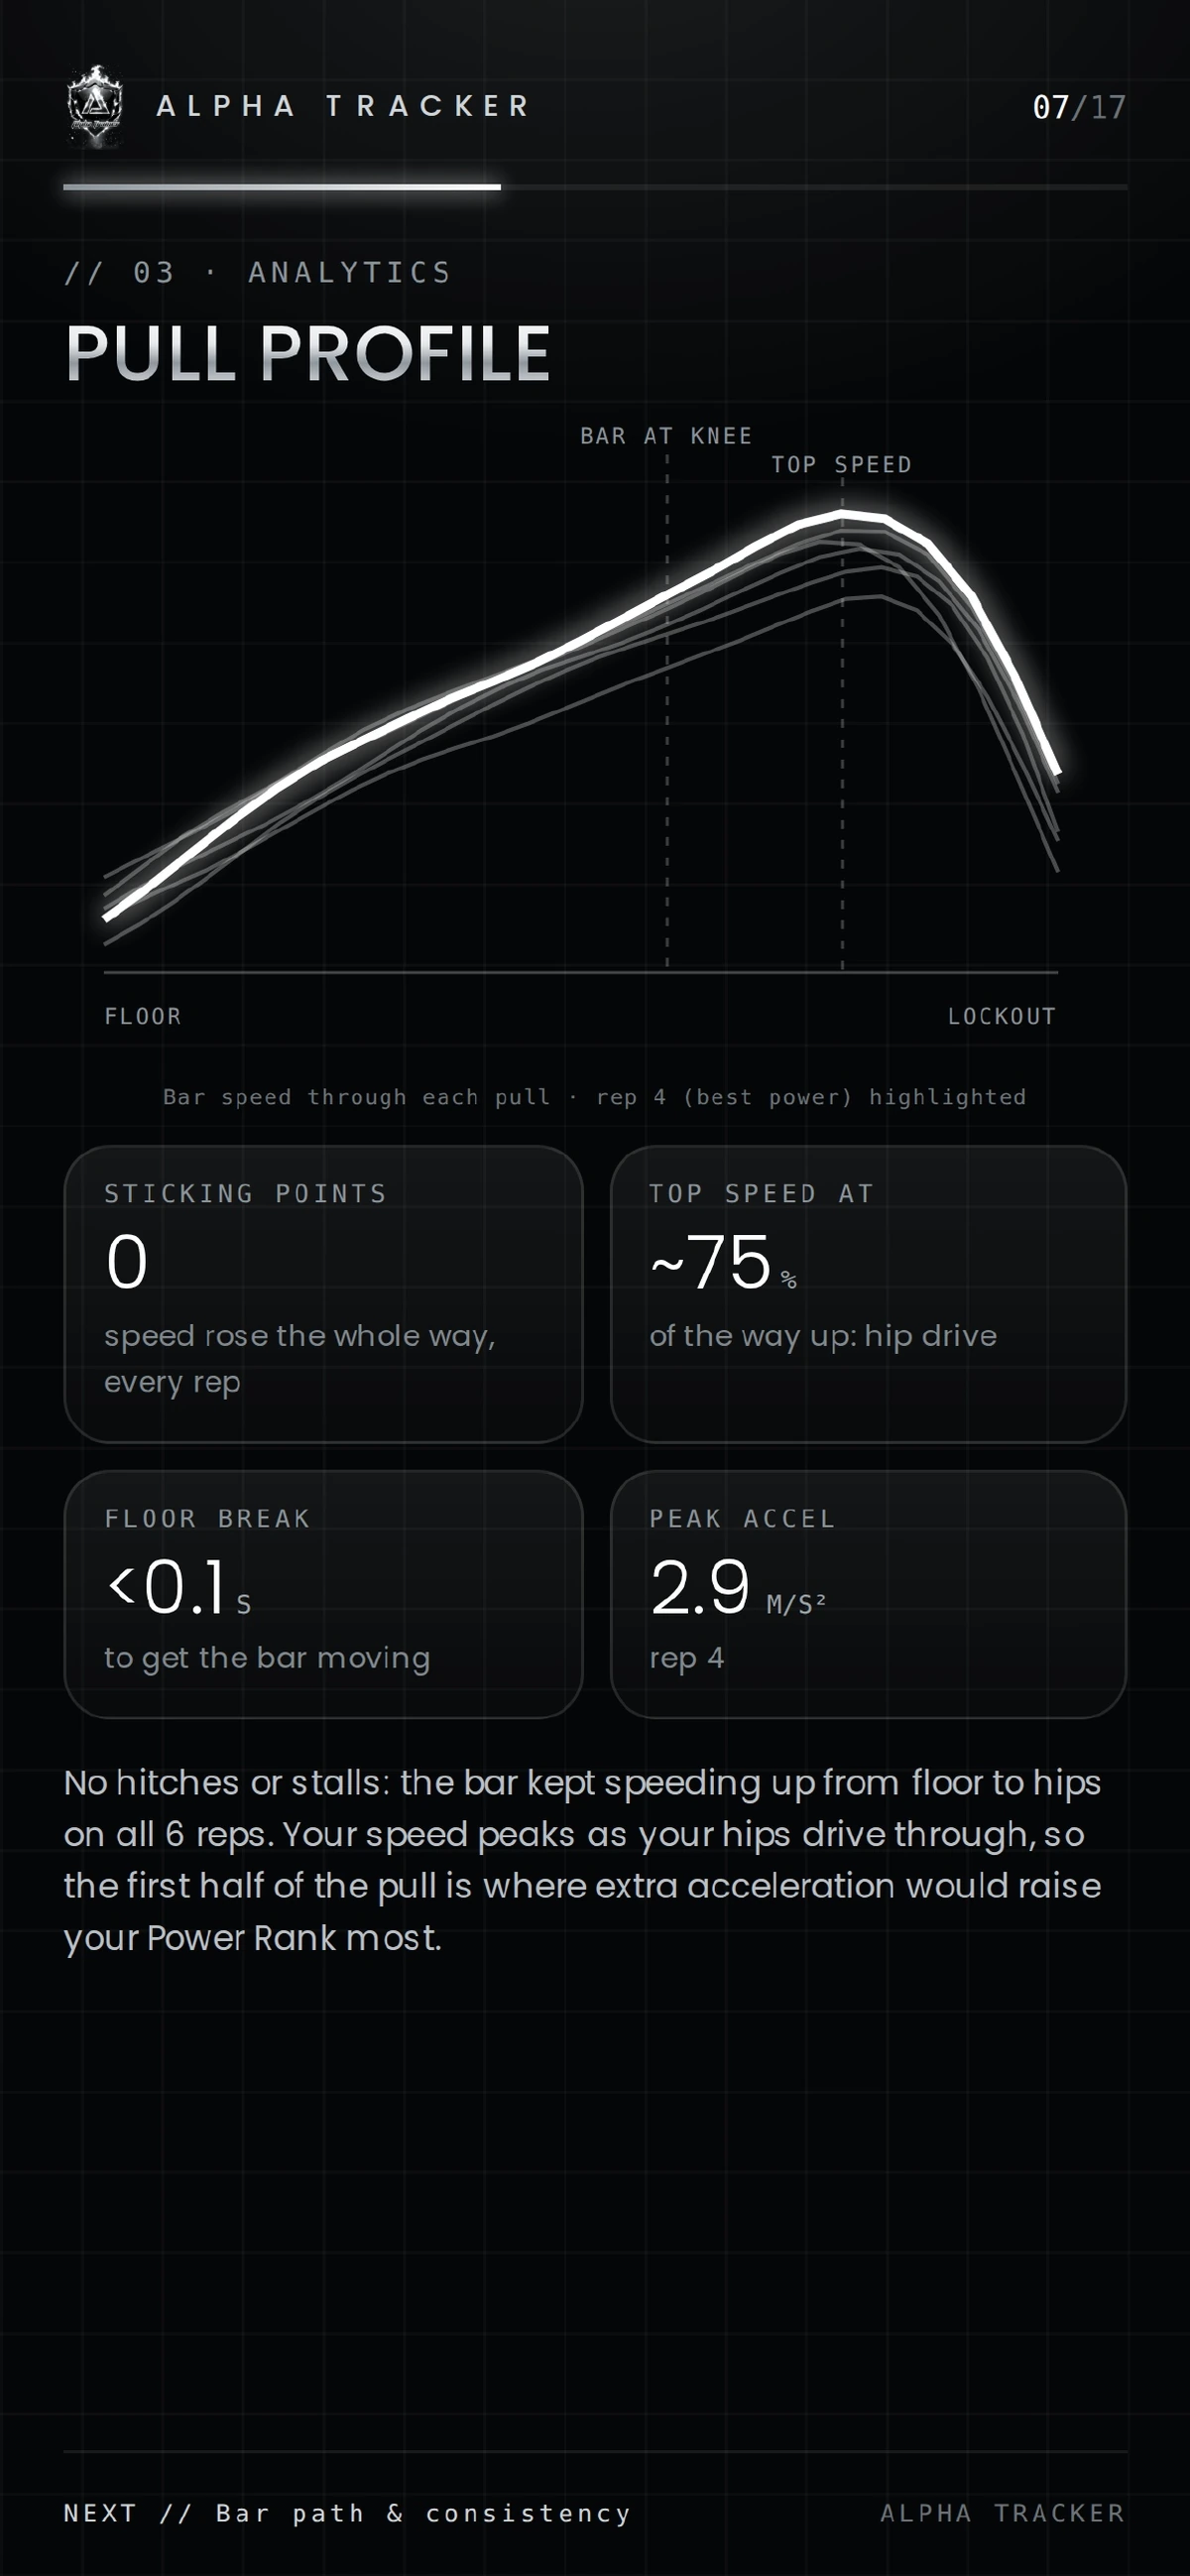
Pull profile
What it shows
Bar speed through each pull, from the floor to lockout, with your best power rep highlighted, plus sticking points, where top speed hits, how fast the bar breaks the floor, and peak acceleration.
How to read it
A smooth rising curve means no hitches or stalls. A dip means a sticking point. The marker shows where in the pull you hit top speed.
Why it matters
It shows exactly which part of the lift to attack, and where extra acceleration would raise your Power Rank most.
04 · Technique
Bar path & consistency
What it shows
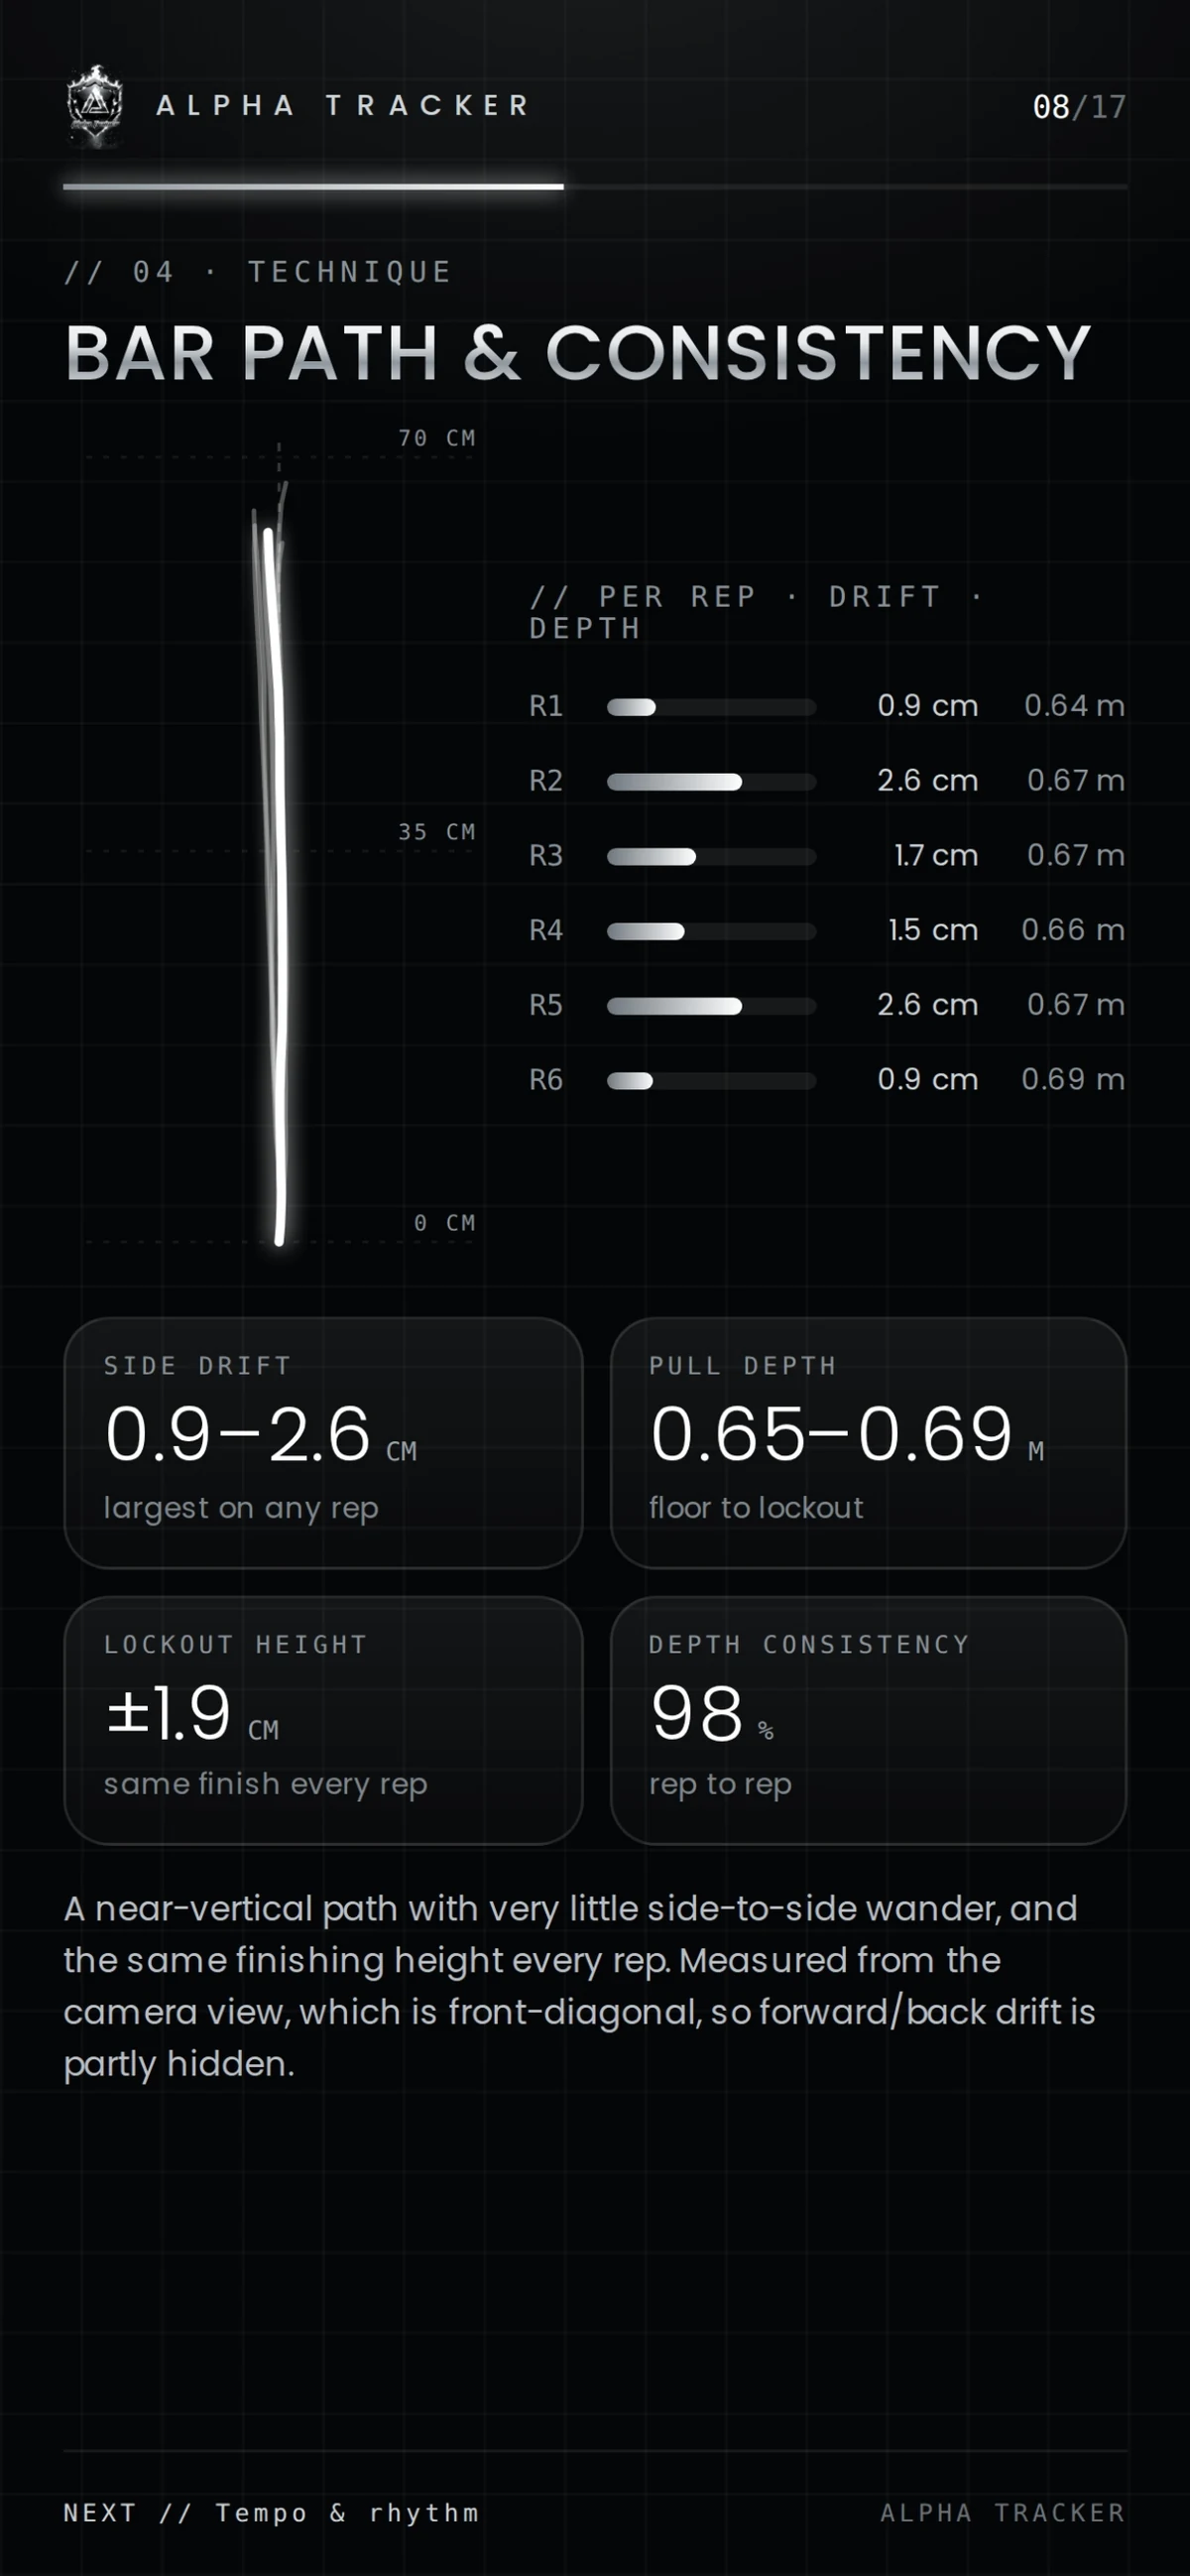
A trace of the bar's path with per-rep side drift and pull depth, plus lockout height and depth consistency across the set.
How to read it
A near-vertical line with little side-to-side wander is what you want, finishing at the same height every rep. The report notes when the camera angle hides some drift.
Why it matters
Repeatable reps are efficient reps. Drift and changing depth are early signs of fatigue or a technique leak.
04 · Technique
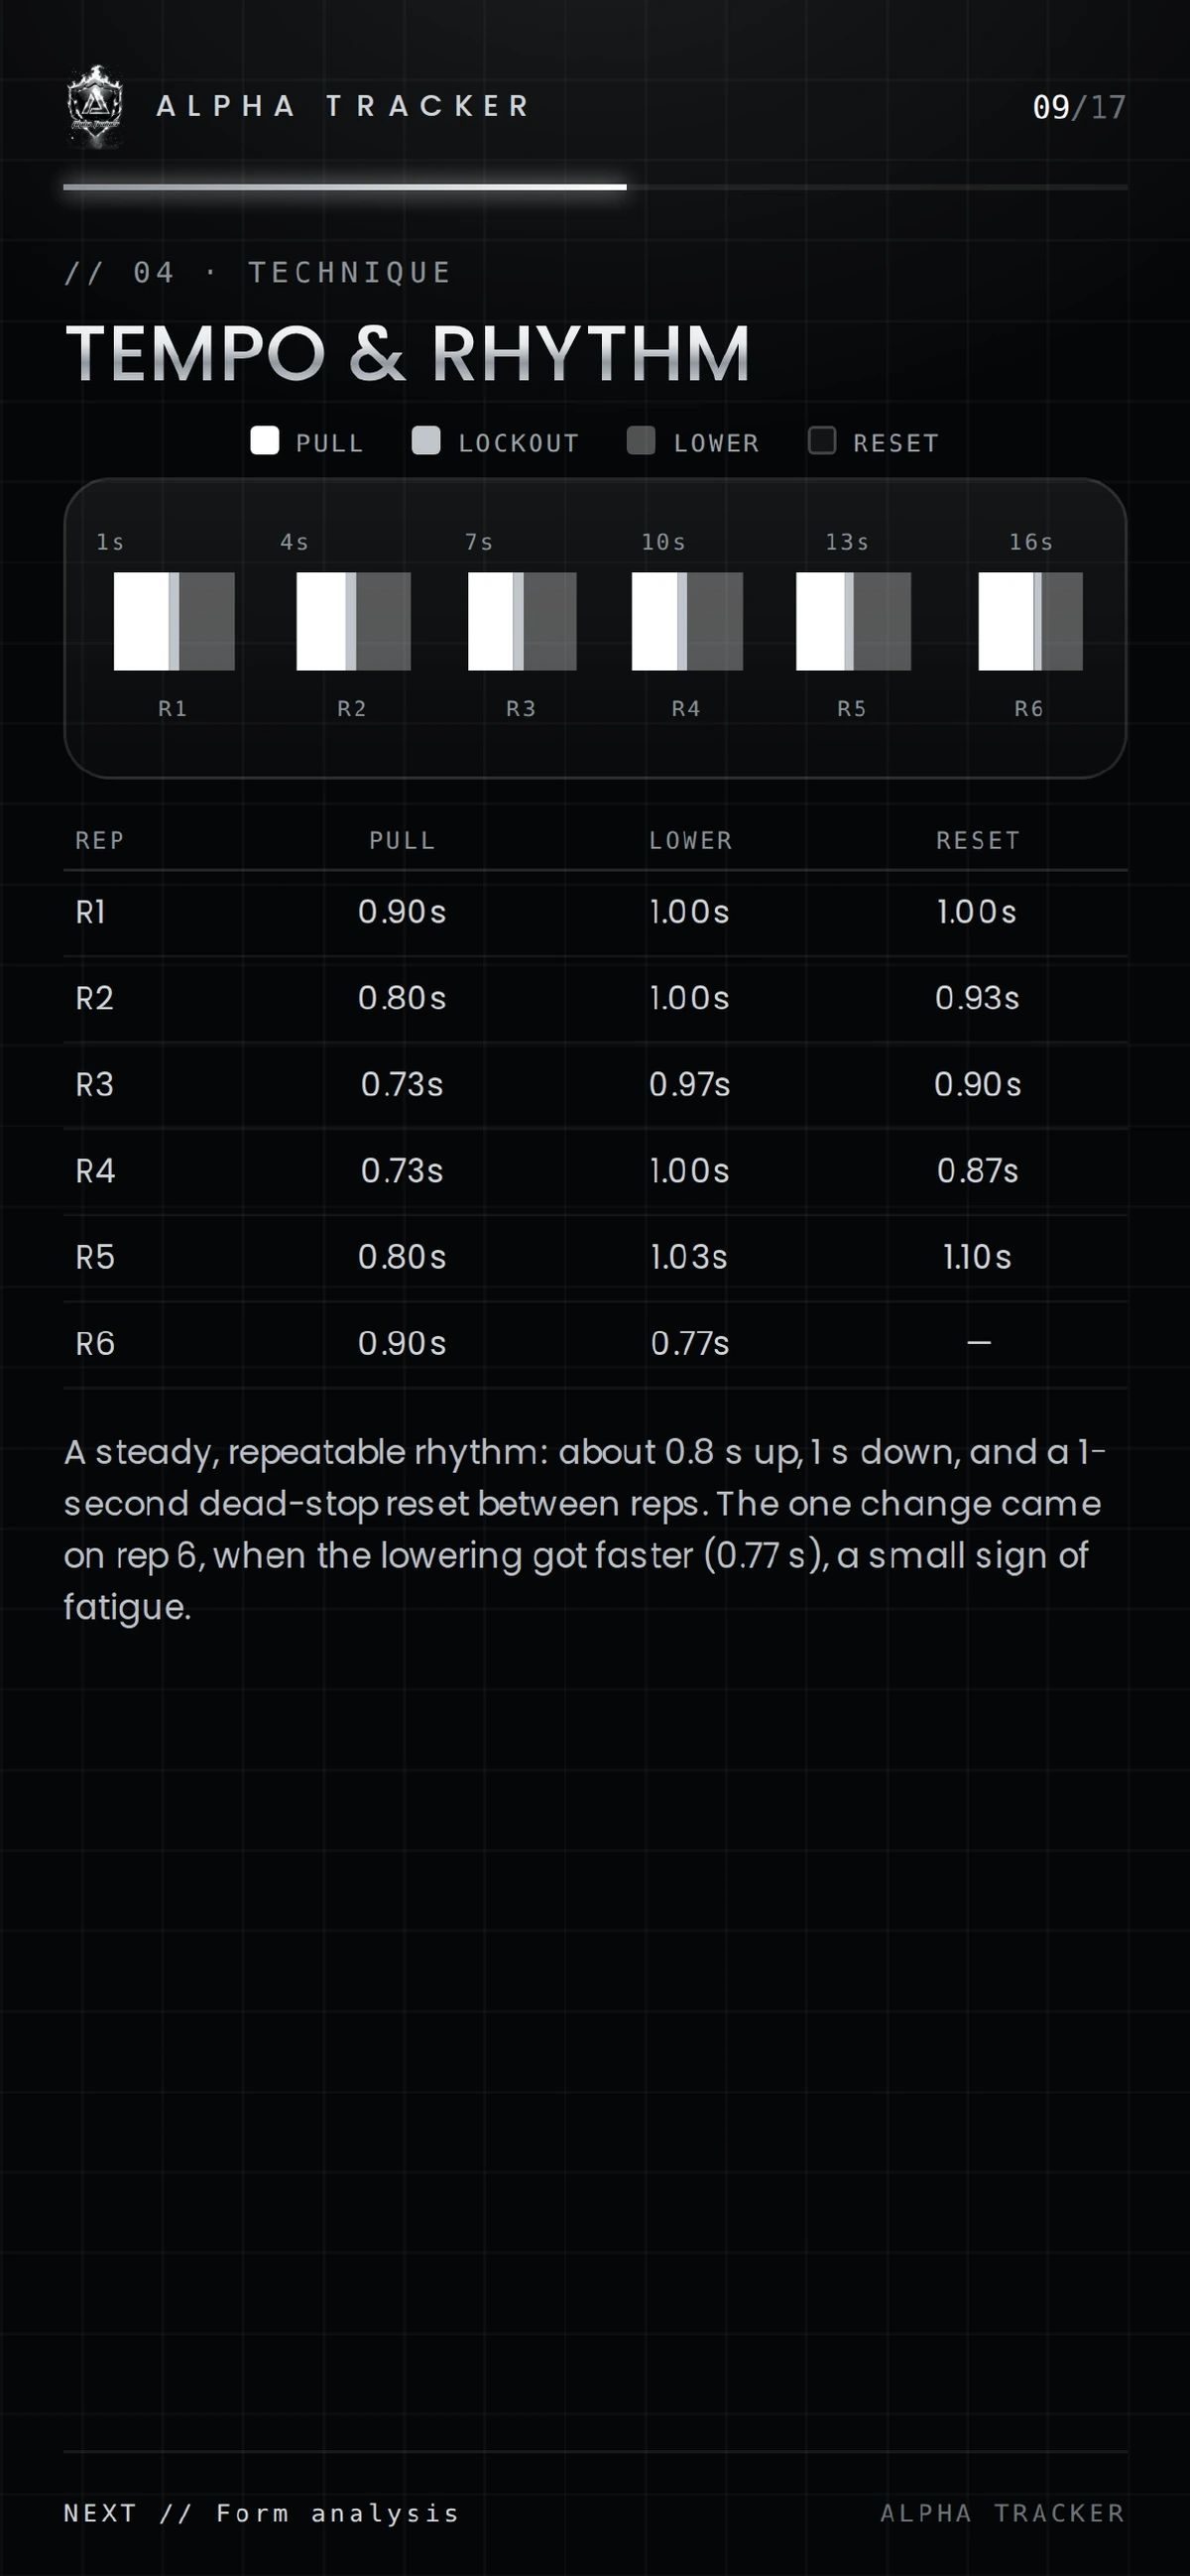
Tempo & rhythm
What it shows
Time spent pulling, lowering and resetting on every rep, as a timeline and a table.
How to read it
Look for a steady, repeatable rhythm. A rep that lowers faster or resets differently stands out immediately.
Why it matters
Rhythm changes are often the first small sign of fatigue, before speed or form visibly break.

05 · Form
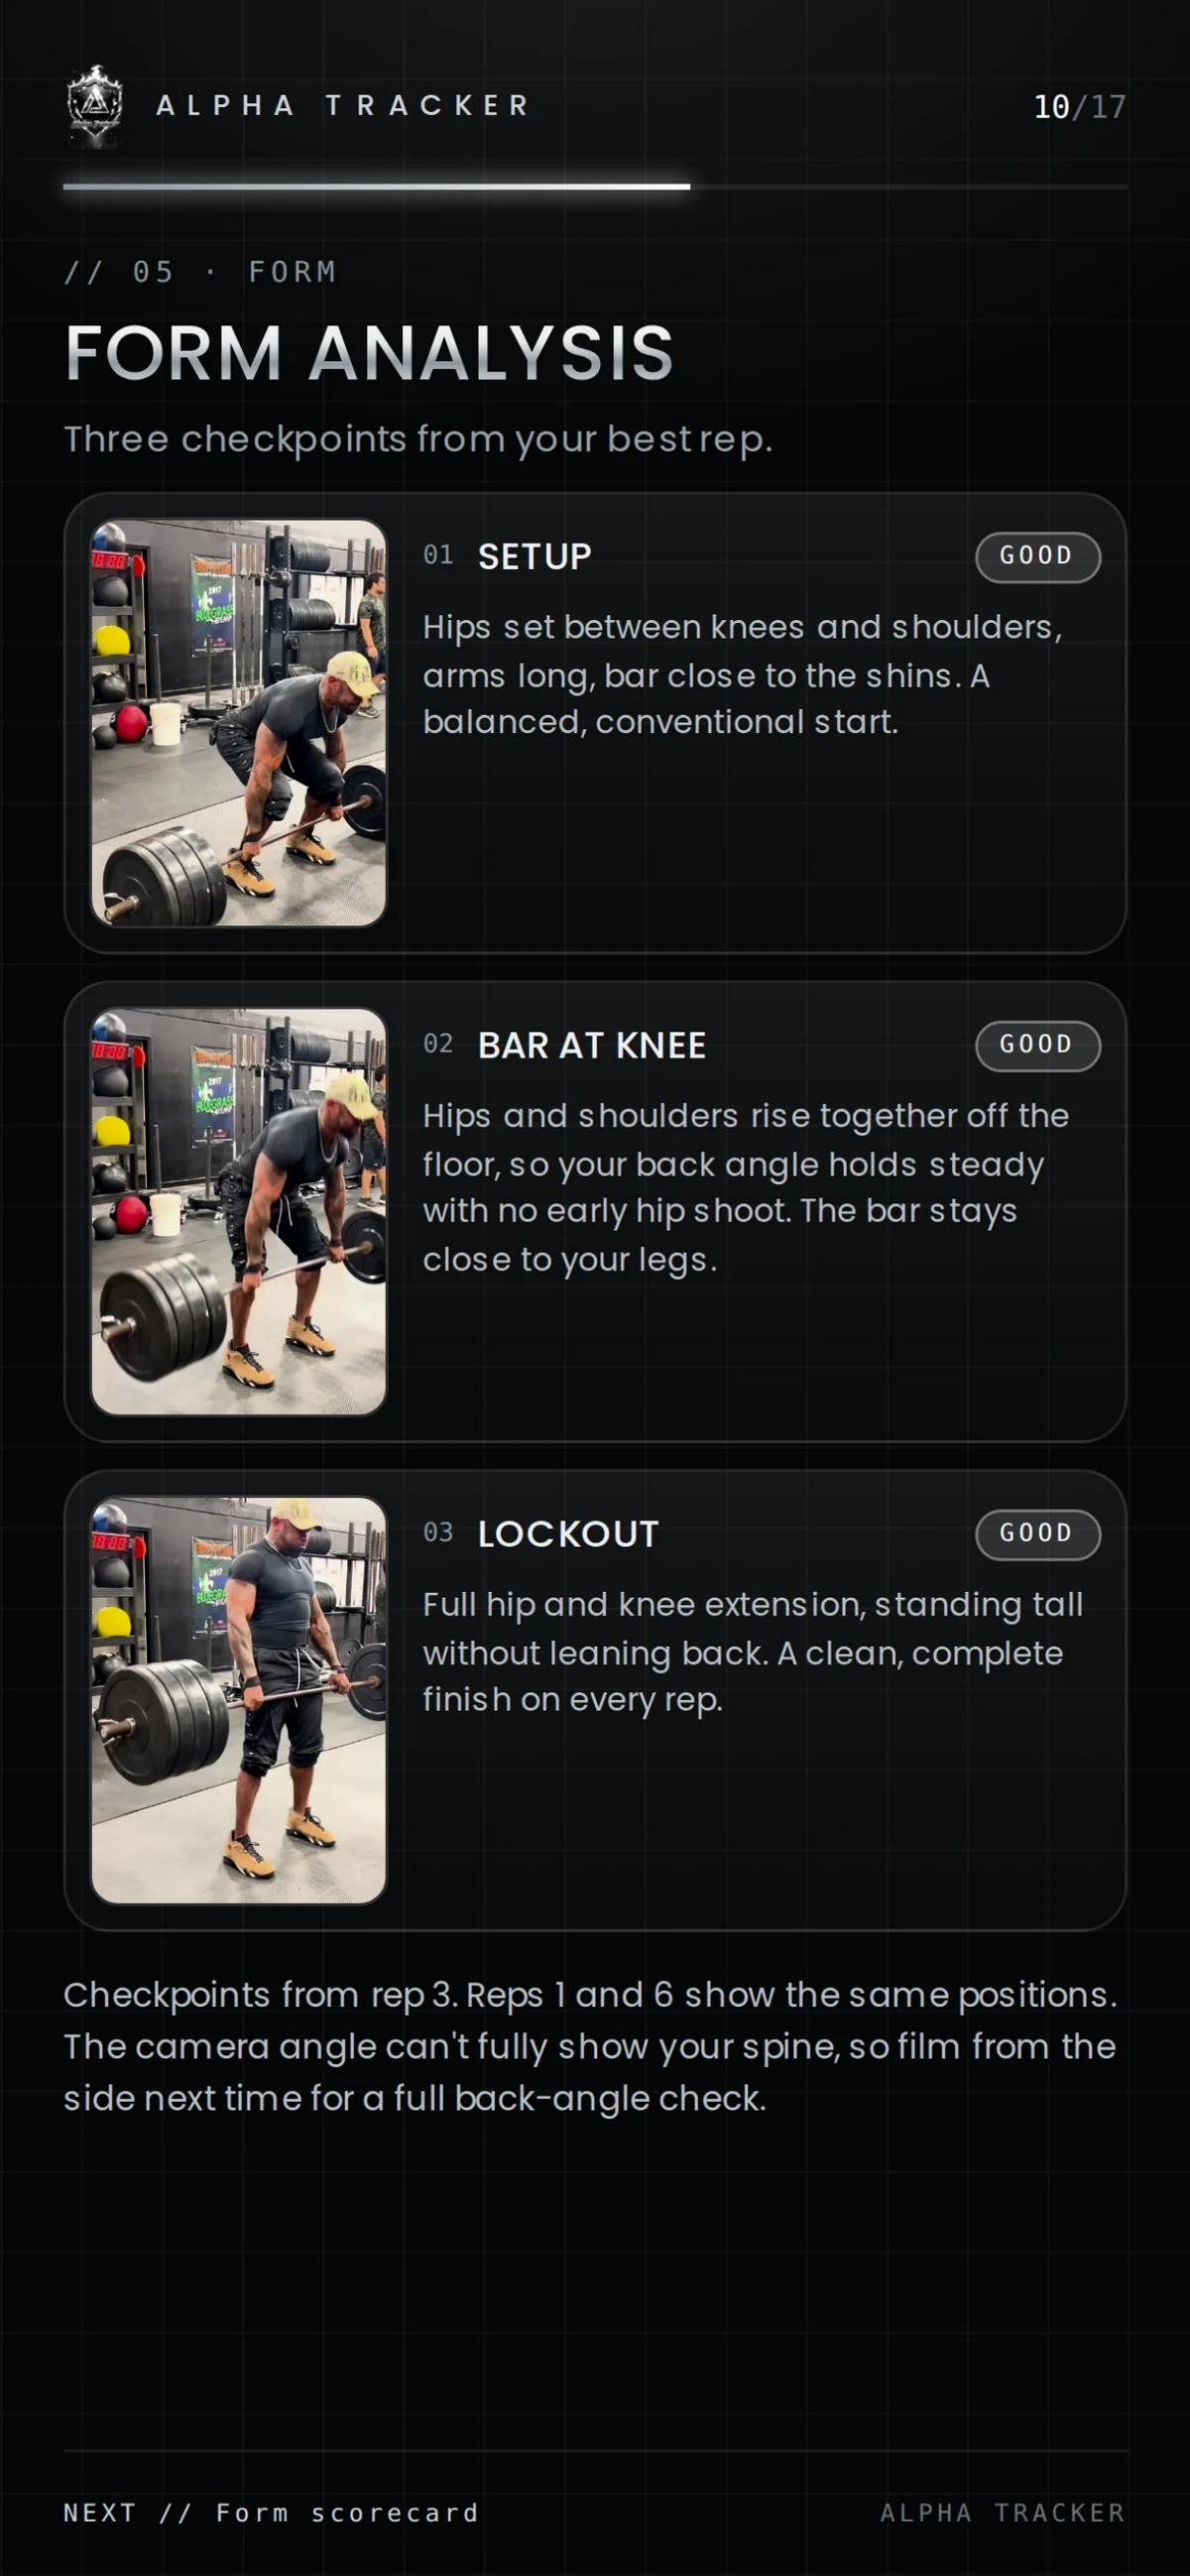
Form analysis & scorecard
What it shows
Three checkpoint frames from your rep (setup, bar at knee, lockout) with a rating and a written breakdown, then a scorecard rating bar path, depth consistency, lockout, smoothness, rhythm and lowering control out of 100.
How to read it
Read each checkpoint's notes against the frame. On the scorecard, the lowest bar is the one to work on. Strengths and watch-outs are listed side by side.
Why it matters
It turns "how did that look?" into specific positions and ratings your coach can coach, and you can track.
06 · Coaching
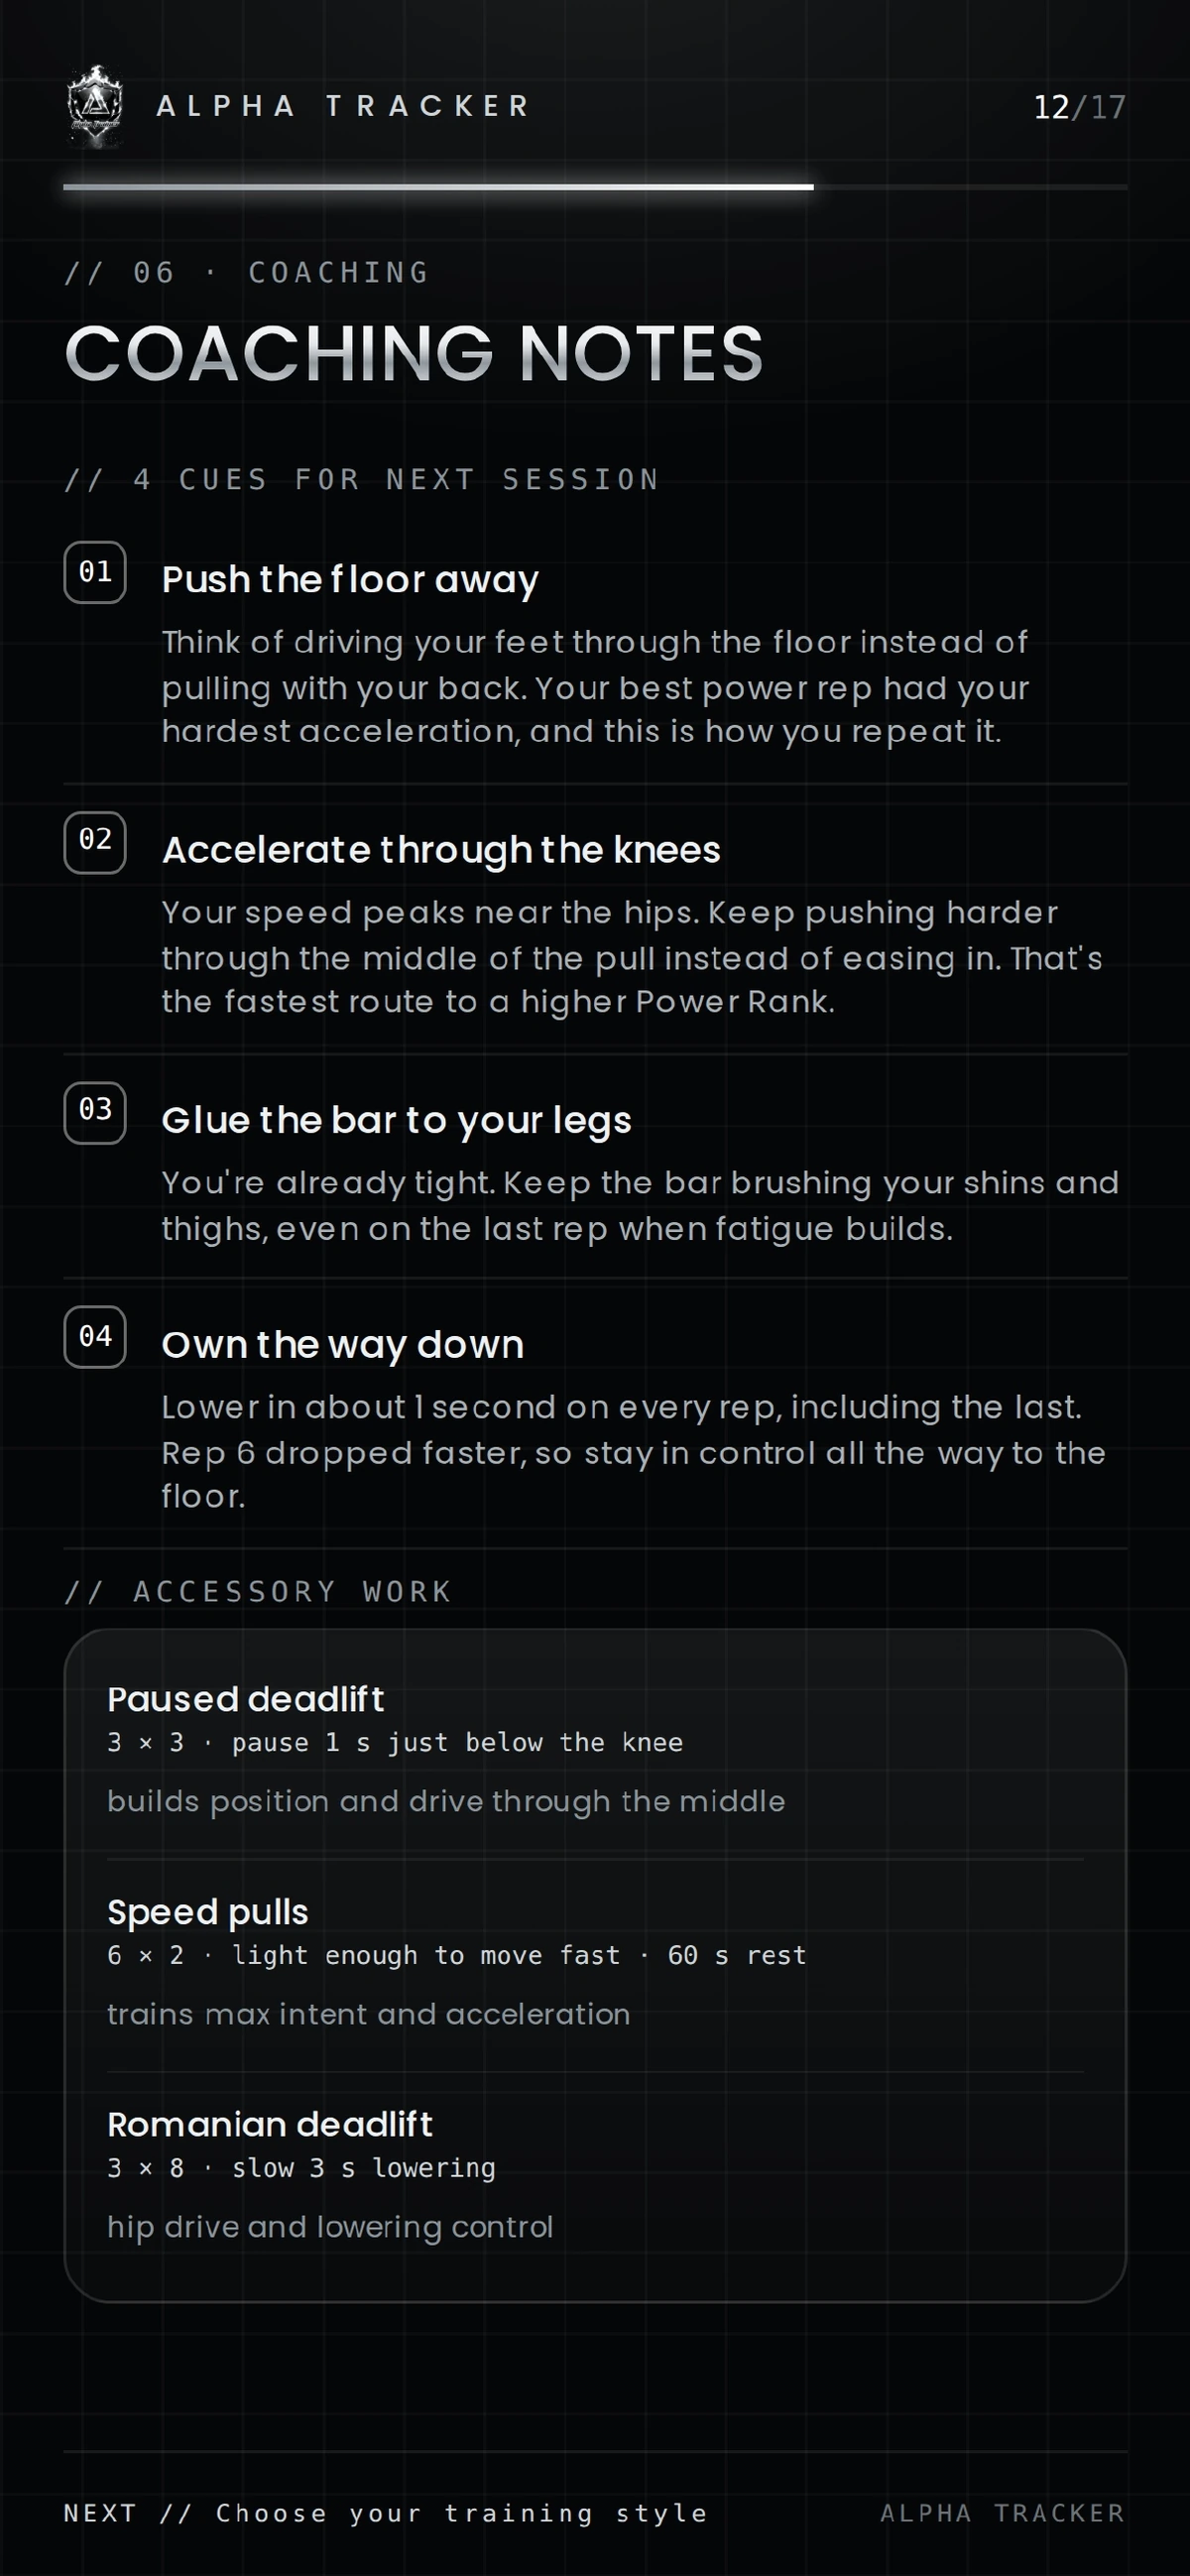
Coaching notes
What it shows
Four cues for your next session, each explained, plus accessory work with sets, reps and the reason for each exercise.
How to read it
Take the cues into your next session one at a time. The accessories target the weak points the data found.
Why it matters
This is where the numbers become instructions: what to think about under the bar and what to train between sessions.


07 · Next session
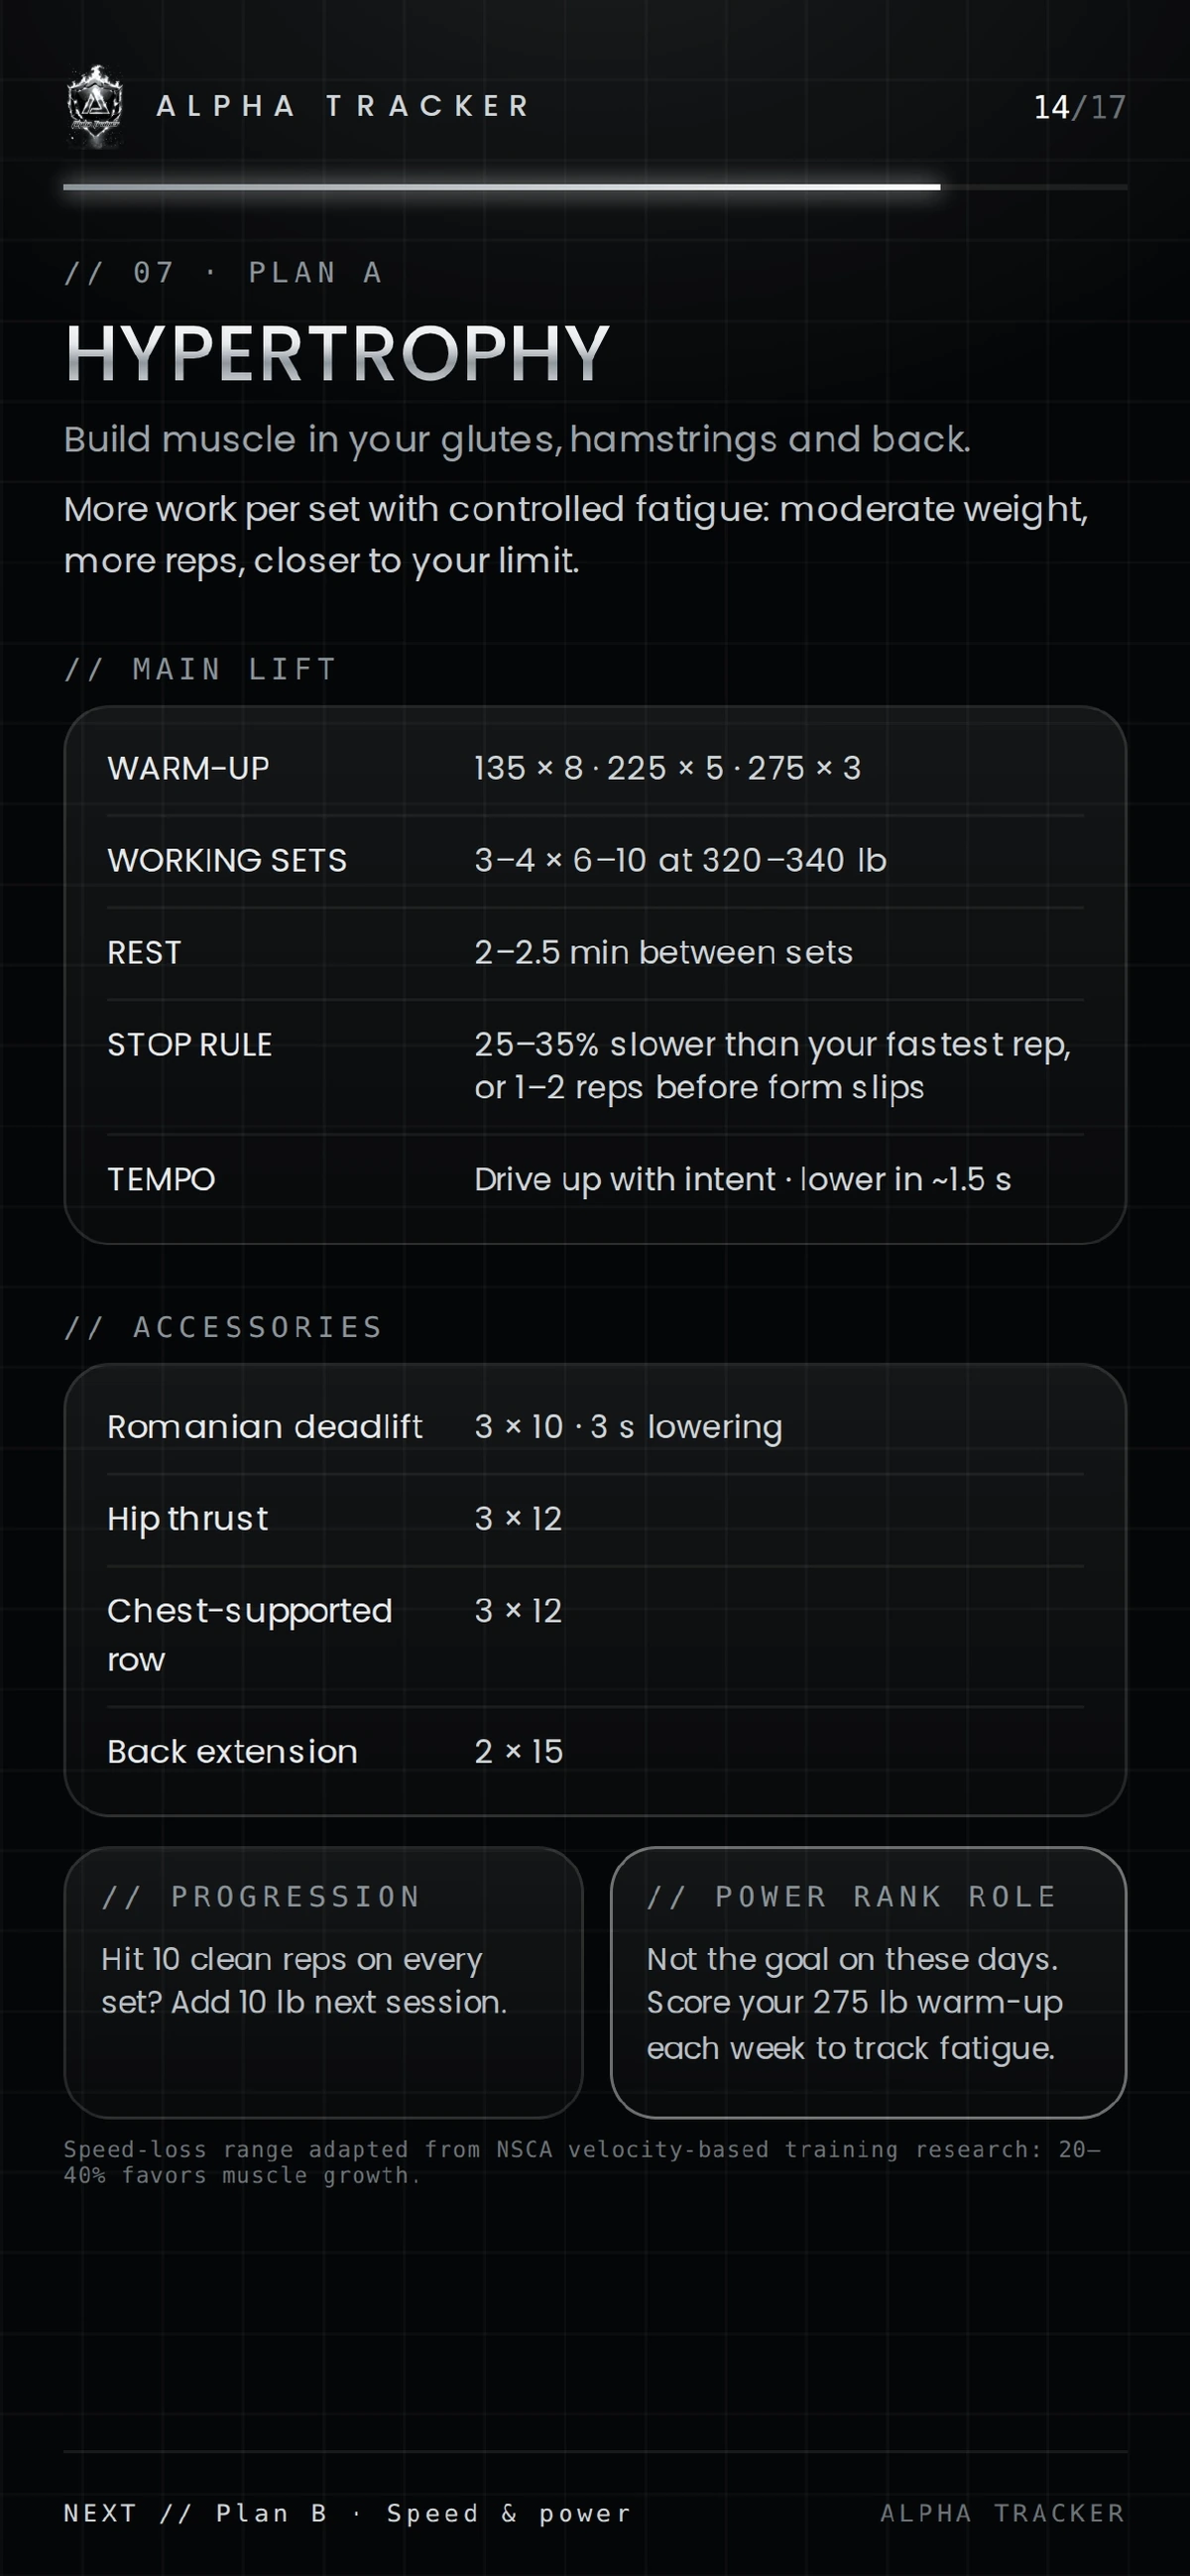
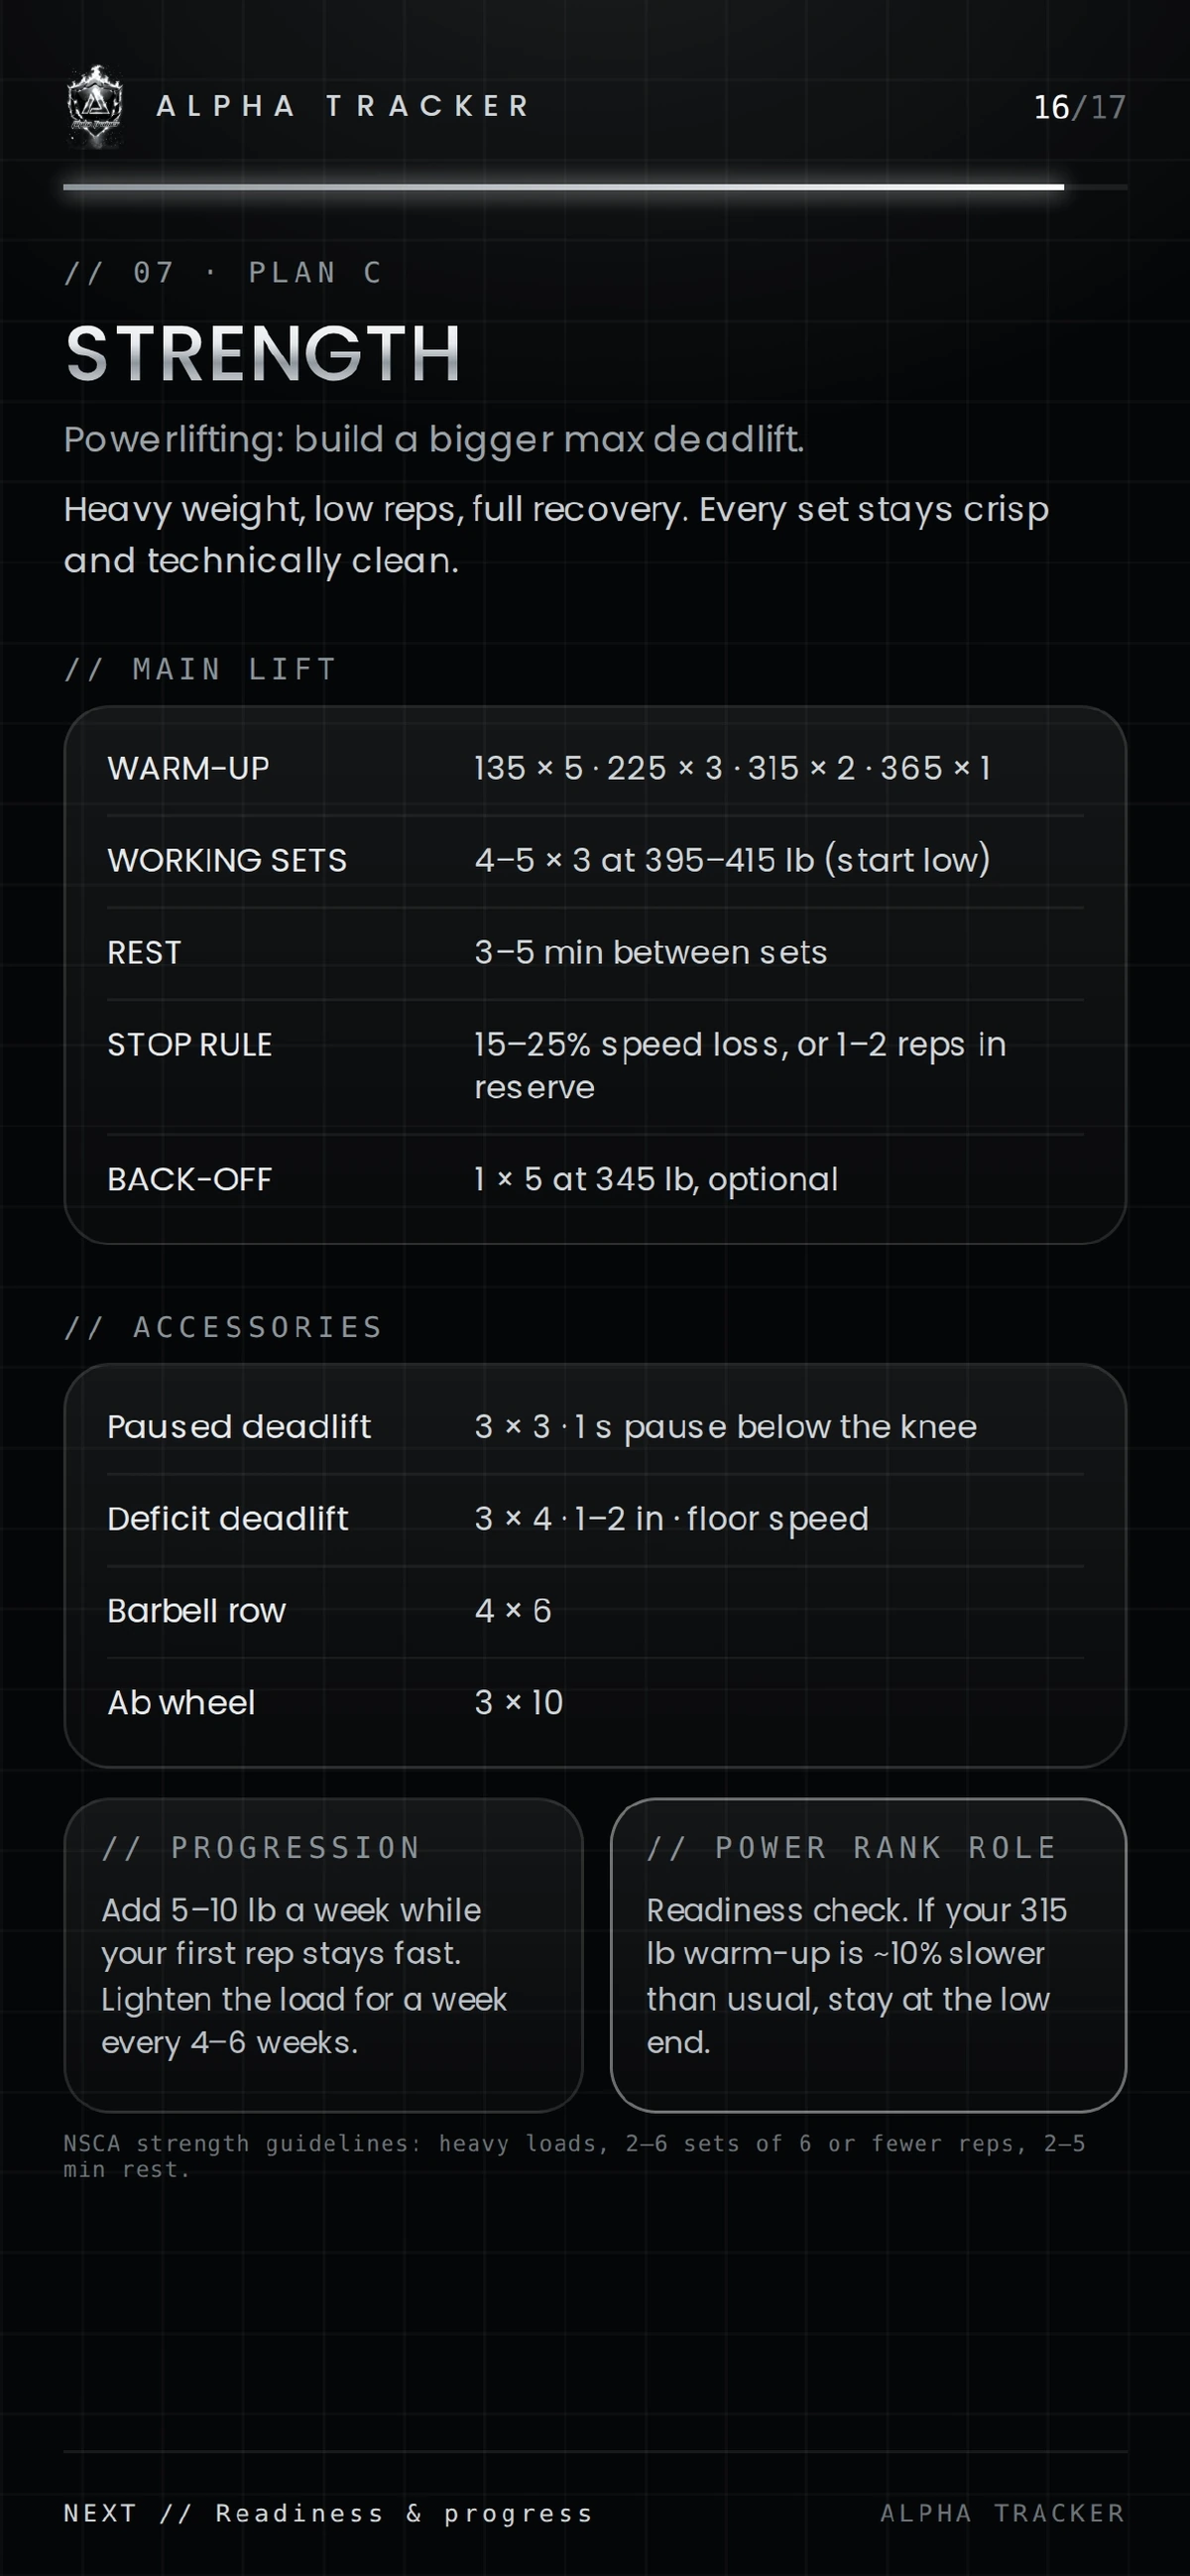
Choose your training style
What it shows
Three next-session plans built from your data: Hypertrophy, Speed & Power, and Strength. Each lists sets and reps, load, rest, a stop rule, warm-up, accessories, a progression rule and the role Power Rank plays in that plan.
How to read it
Pick the plan for your goal. Loads are starting points, adjusted by bar speed, and "stop at" means end the set when reps get that much slower than your fastest rep.
Why it matters
Your next session is planned from what your bar actually did, not from a percentage chart or a guess.

08 · Progress
Readiness & progress
What it shows
A Power Rank test to repeat every 2–4 weeks, a readiness check, filming instructions, a recovery rule, and targets for your Power Rank, rep 1 speed and speed drop.
How to read it
Retest with the same weight, setup and camera. If your warm-up bar speed is clearly slower than last time (about 10% or more), keep that day's loads at the low end of your plan.
Why it matters
It closes the loop: test, train, retest, and adjust on bad days instead of grinding through them.
Filming guide
Film it right
No sensors, no wearables. Just your phone and a good angle. The report tracks your video frame by frame, so the camera position matters.
- 01
Set the phone side-on
Film from the side, phone at hip height.
- 02
Get it all in frame
The whole bar and your whole body, start to lockout.
- 03
Keep it the same
Same setup and same camera position every time you retest.
- 04
Why side-on
A side view unlocks the full back-angle and bar-path check. Front-diagonal angles hide forward and back drift and your spine.
The sample report on this page is a conventional deadlift. Your coach tells you which lifts and sets to film.
What your coach does with it
Data in. Program out.
- Set your loadsChoose the plan that fits your goal and set working weights from your bar speed, not a guess.
- Coach your positionsUse the checkpoints and scorecard to pick the cues that matter.
- Program accessoriesBuild accessory work around the weak points the report found.
- Manage fatigueUse speed loss and readiness checks to decide when to push and when to hold back.
- Track progressRetest Power Rank every few weeks with the same setup and compare.
How it fits 1:1 coaching
Alpha Tracker isn't sold separately. It's part of Alpha Trainer 1:1 coaching, alongside custom workout design, constant contact and diet monitoring. You film, your coach reads the report with you, and your program changes because of it.
Fill Out the Application →FAQ
Questions, answered
Is Alpha Tracker sold separately?
No. It's a feature of 1:1 coaching, not a standalone product.
Do I need special equipment?
No sensors or wearables. Just your phone, filmed side-on with the whole bar in frame.
Which lifts can be tracked?
The sample report on this page is a conventional deadlift. Your coach tells you which lifts and sets to film.
How is the Power Rank calculated?
From the most powerful single moment of your set: force × speed gives peak power in watts, watts ÷ 745.7 gives horsepower, and horsepower × 25 gives your rank. 4 hp is a perfect 100.
Does my body weight count toward the score?
No. The numbers are bar-only; your body's own movement isn't included.
What do the tiers mean?
APEX 90–100, ALPHA 75–89, HUNTER 50–74, LONE WOLF 25–49, PUP 0–24.
What is speed loss and why does it matter?
How much slower your later reps are than your fastest. It's used to control fatigue and to decide when to end a set for your goal.
How often should I retest?
The report recommends a Power Rank test every 2–4 weeks with the same weight, setup and camera.
What if I'm slow on a given day?
The readiness check compares your warm-up bar speed with last time. If you're clearly slower, about 10% or more, keep that day's loads at the low end of your plan.
Why film from the side?
A side view unlocks the full back-angle and bar-path check. Other angles can hide forward and back drift.
Does it replace my coach?
No. The report gives the data; your coach turns it into your next program, cues and progressions.
Want your lifts measured?
Alpha Tracker comes with 1:1 coaching. Applications are reviewed personally.
Fill Out the Application →